1 / Consultation
2 / Visual Study on 3D Data
3 / Identity Experiment 1
CONSULTATION
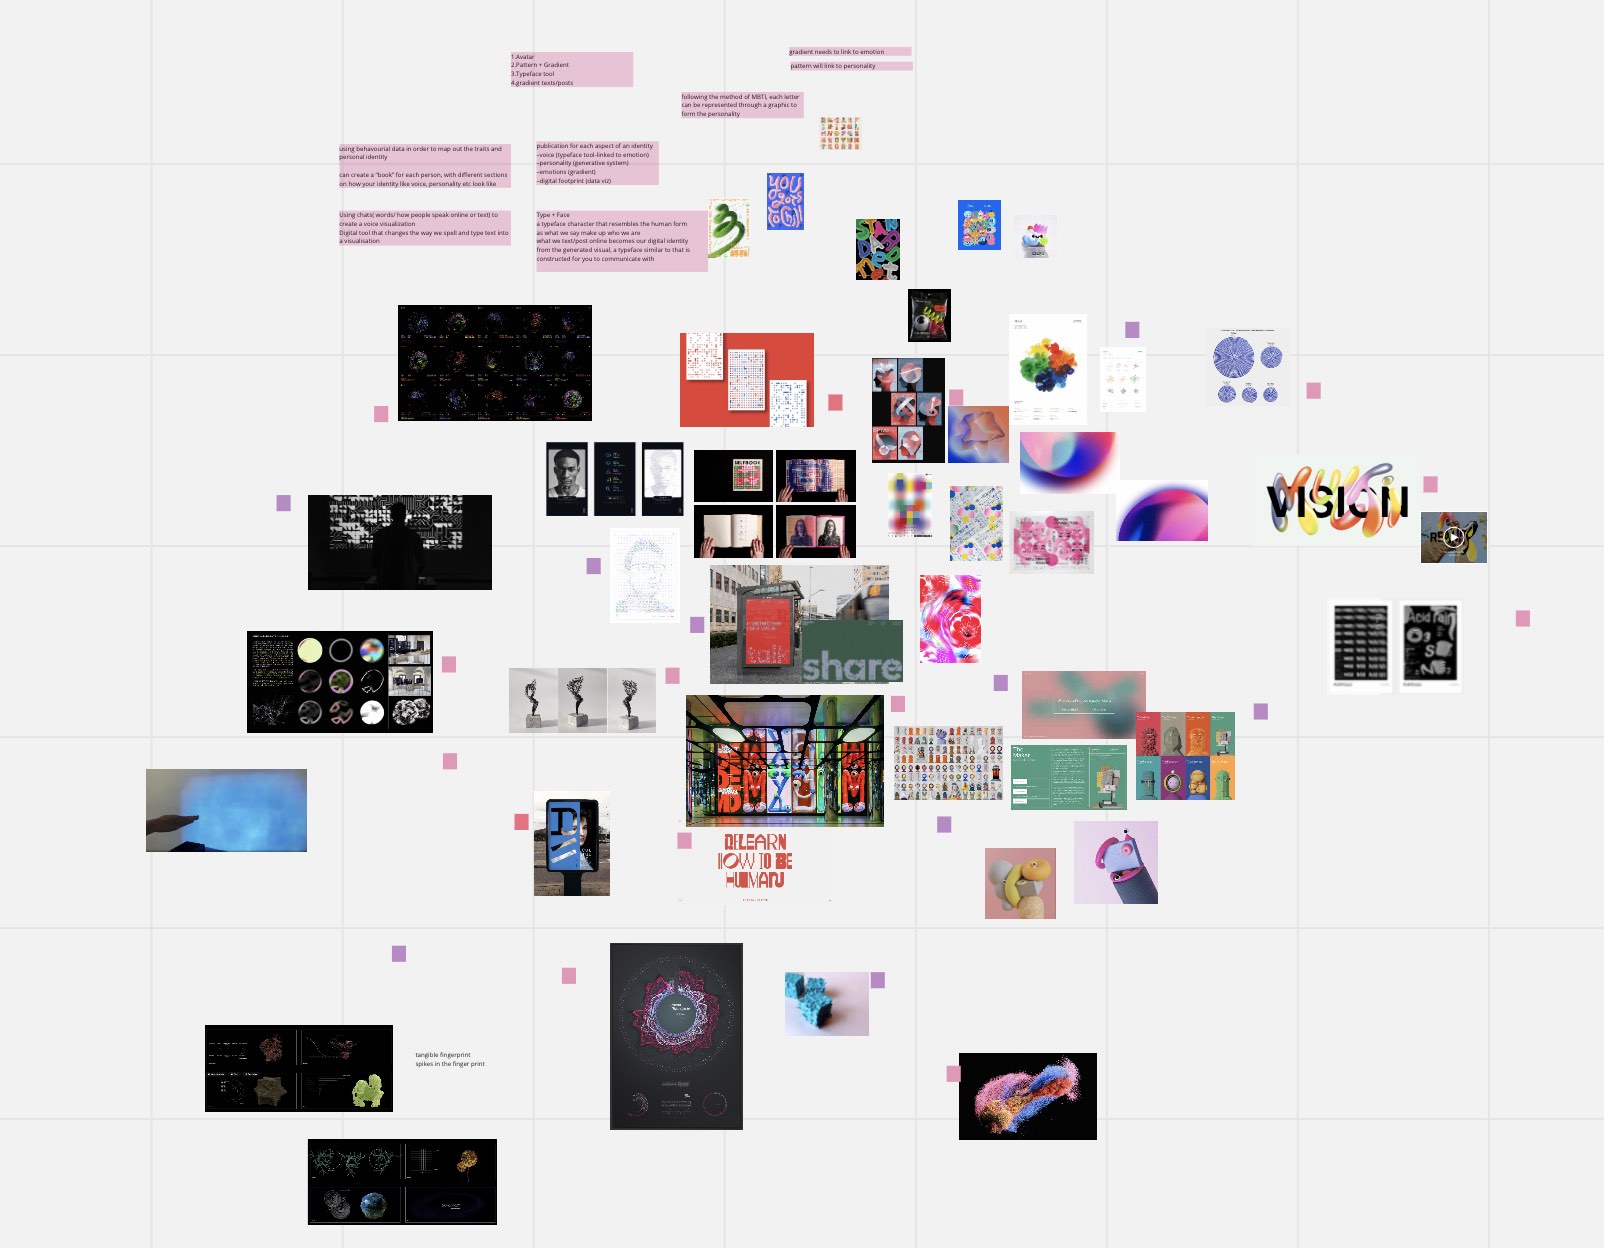
This week’s consultation I showed the visual study I’ve gathered from weeks 7 & 8. I’ve also shared some concerns as to what a prototype should entail and what must be presented for the final outcome.
– Experiments on how a medium can portray identity can then be refined and developed into prototypes that are ready for user-testing, they should be workable for the user experience.
E.g if you’re doing interface design, the interface should be able to be navigated by the user, to test the design of the interface.
– Should conduct user-testing on the prototypes to garner discussions on whether the personality well-defines the identity for different people
– You can prepare three different visualisations of identities and come together to ask people what they think, which visualisation represents their identity the best?
– The final outcome will be a collection and documentation of all the processes, from experiments to prototypes, to discussions and findings.
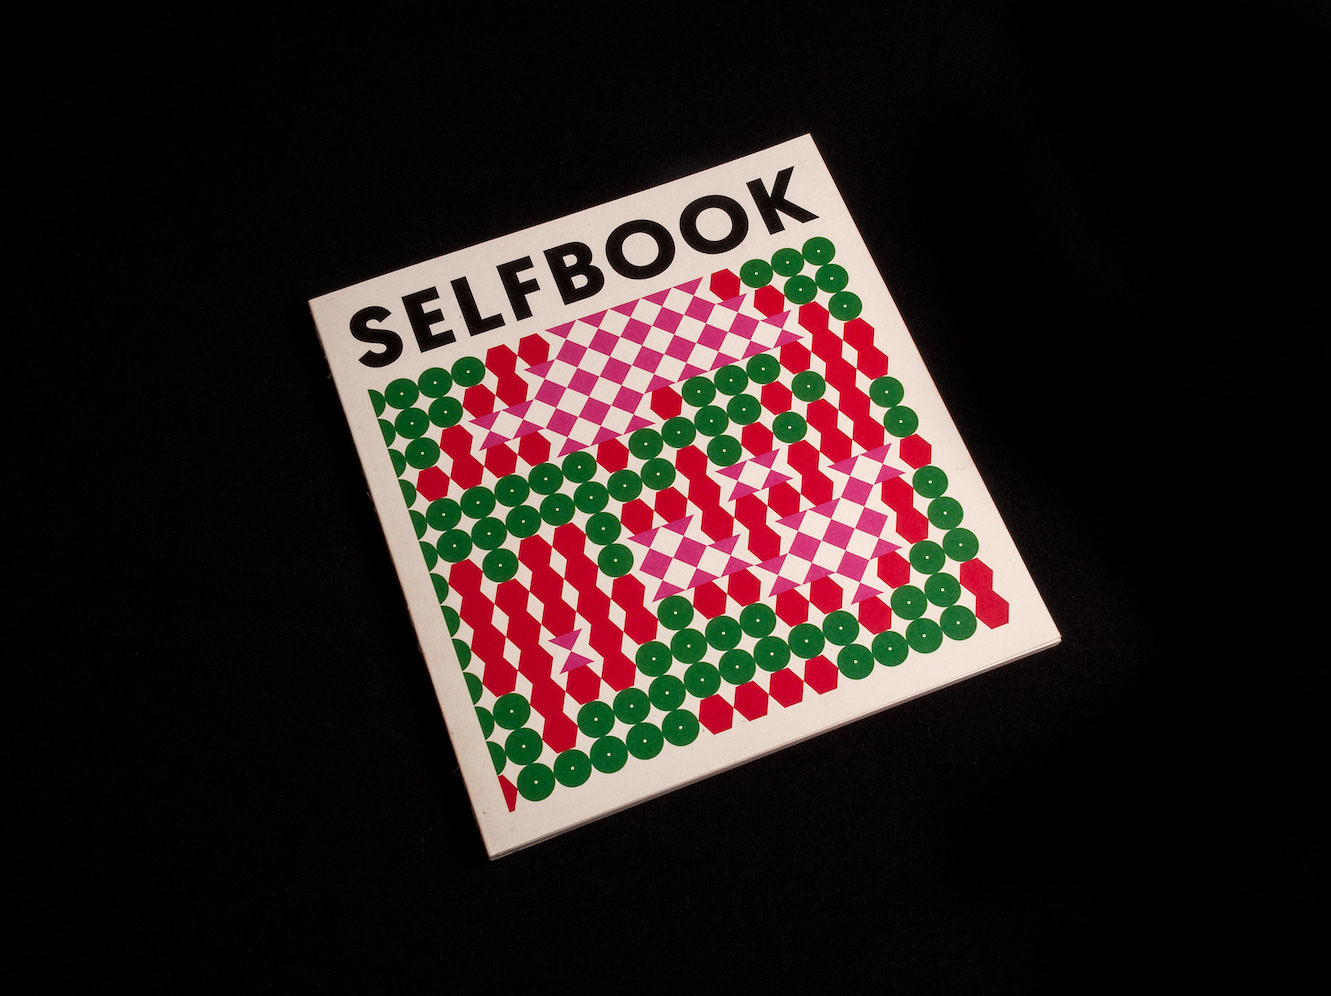
From the visual study, Seoyeon picked selfbook as the image that would potentially portray identity best and Andreas picked the project Data as Object visualising the digital footprint of the user. For the 3D designed characters they might not be the best suited representation despite the visuals being popular amongst younger generations.
I think the two projects as referenced are good starting points to pursue my experiments in.
I liked how in the self-book, the traits and connotations can be easily comprehended and the visuals are quite straightforward in their meaning. For the Data As Object, I like the tangible form of the visualisation, I think that is what connects digital and physical, it creates a bridge between data and humans.
Through the experiments in this term, I want to compare and analyse the effectiveness of different representations of identities, and how different forms and mediums used can affect the feelings of connectedness with the self.
VISUAL STUDY ON 3D DATA
Starting off with the Data as Object concept, I tried to find other case studies and projects that utilises data in a 3-dimensional form.
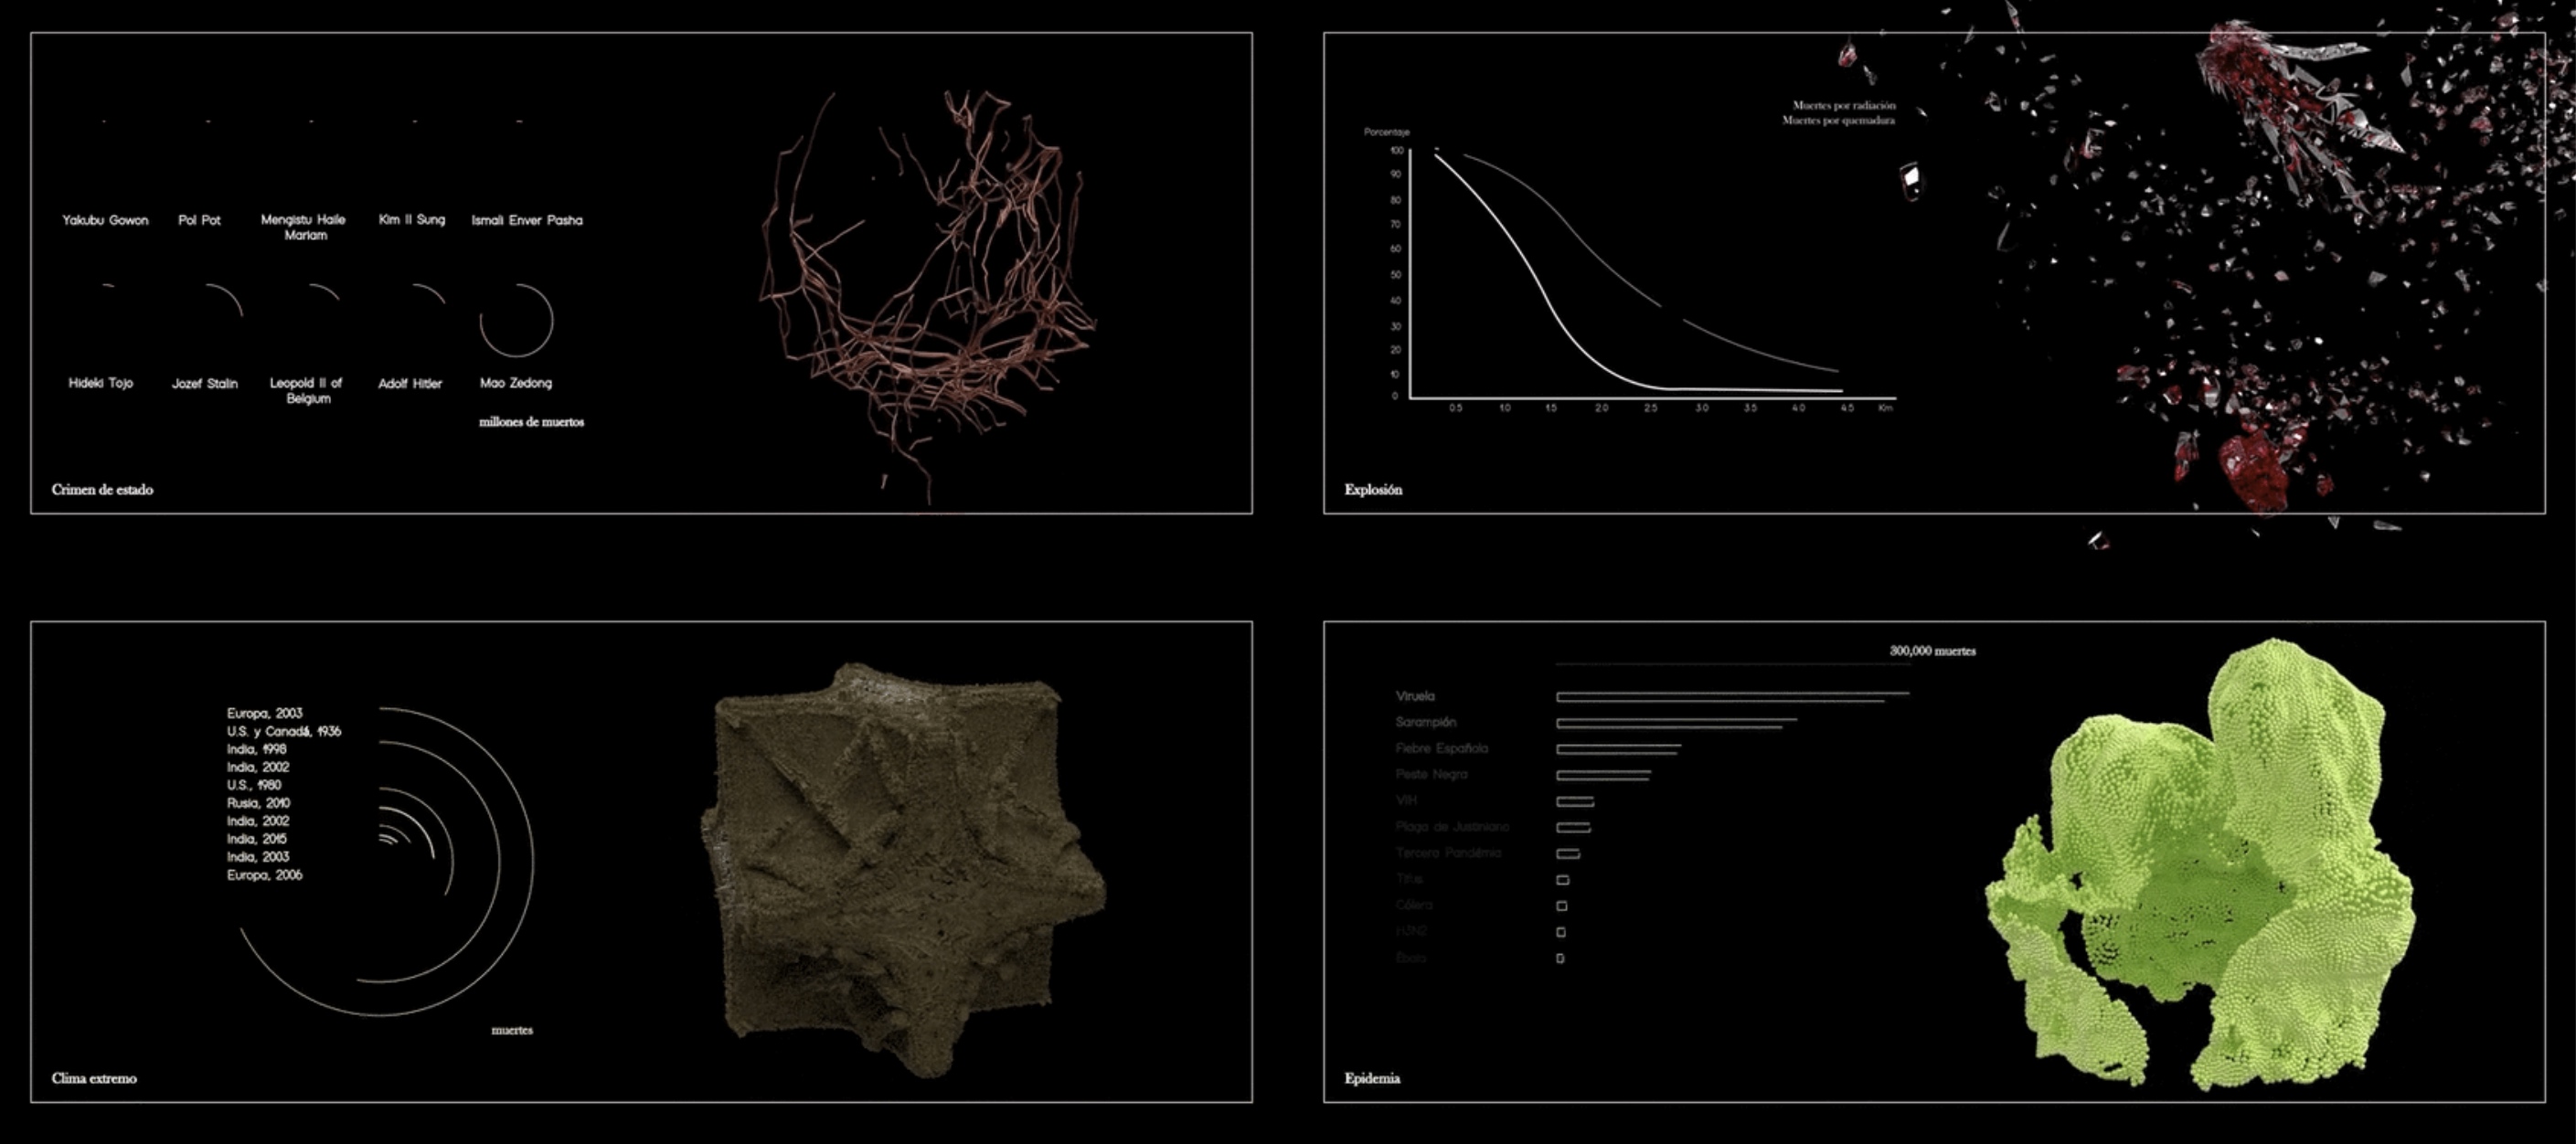
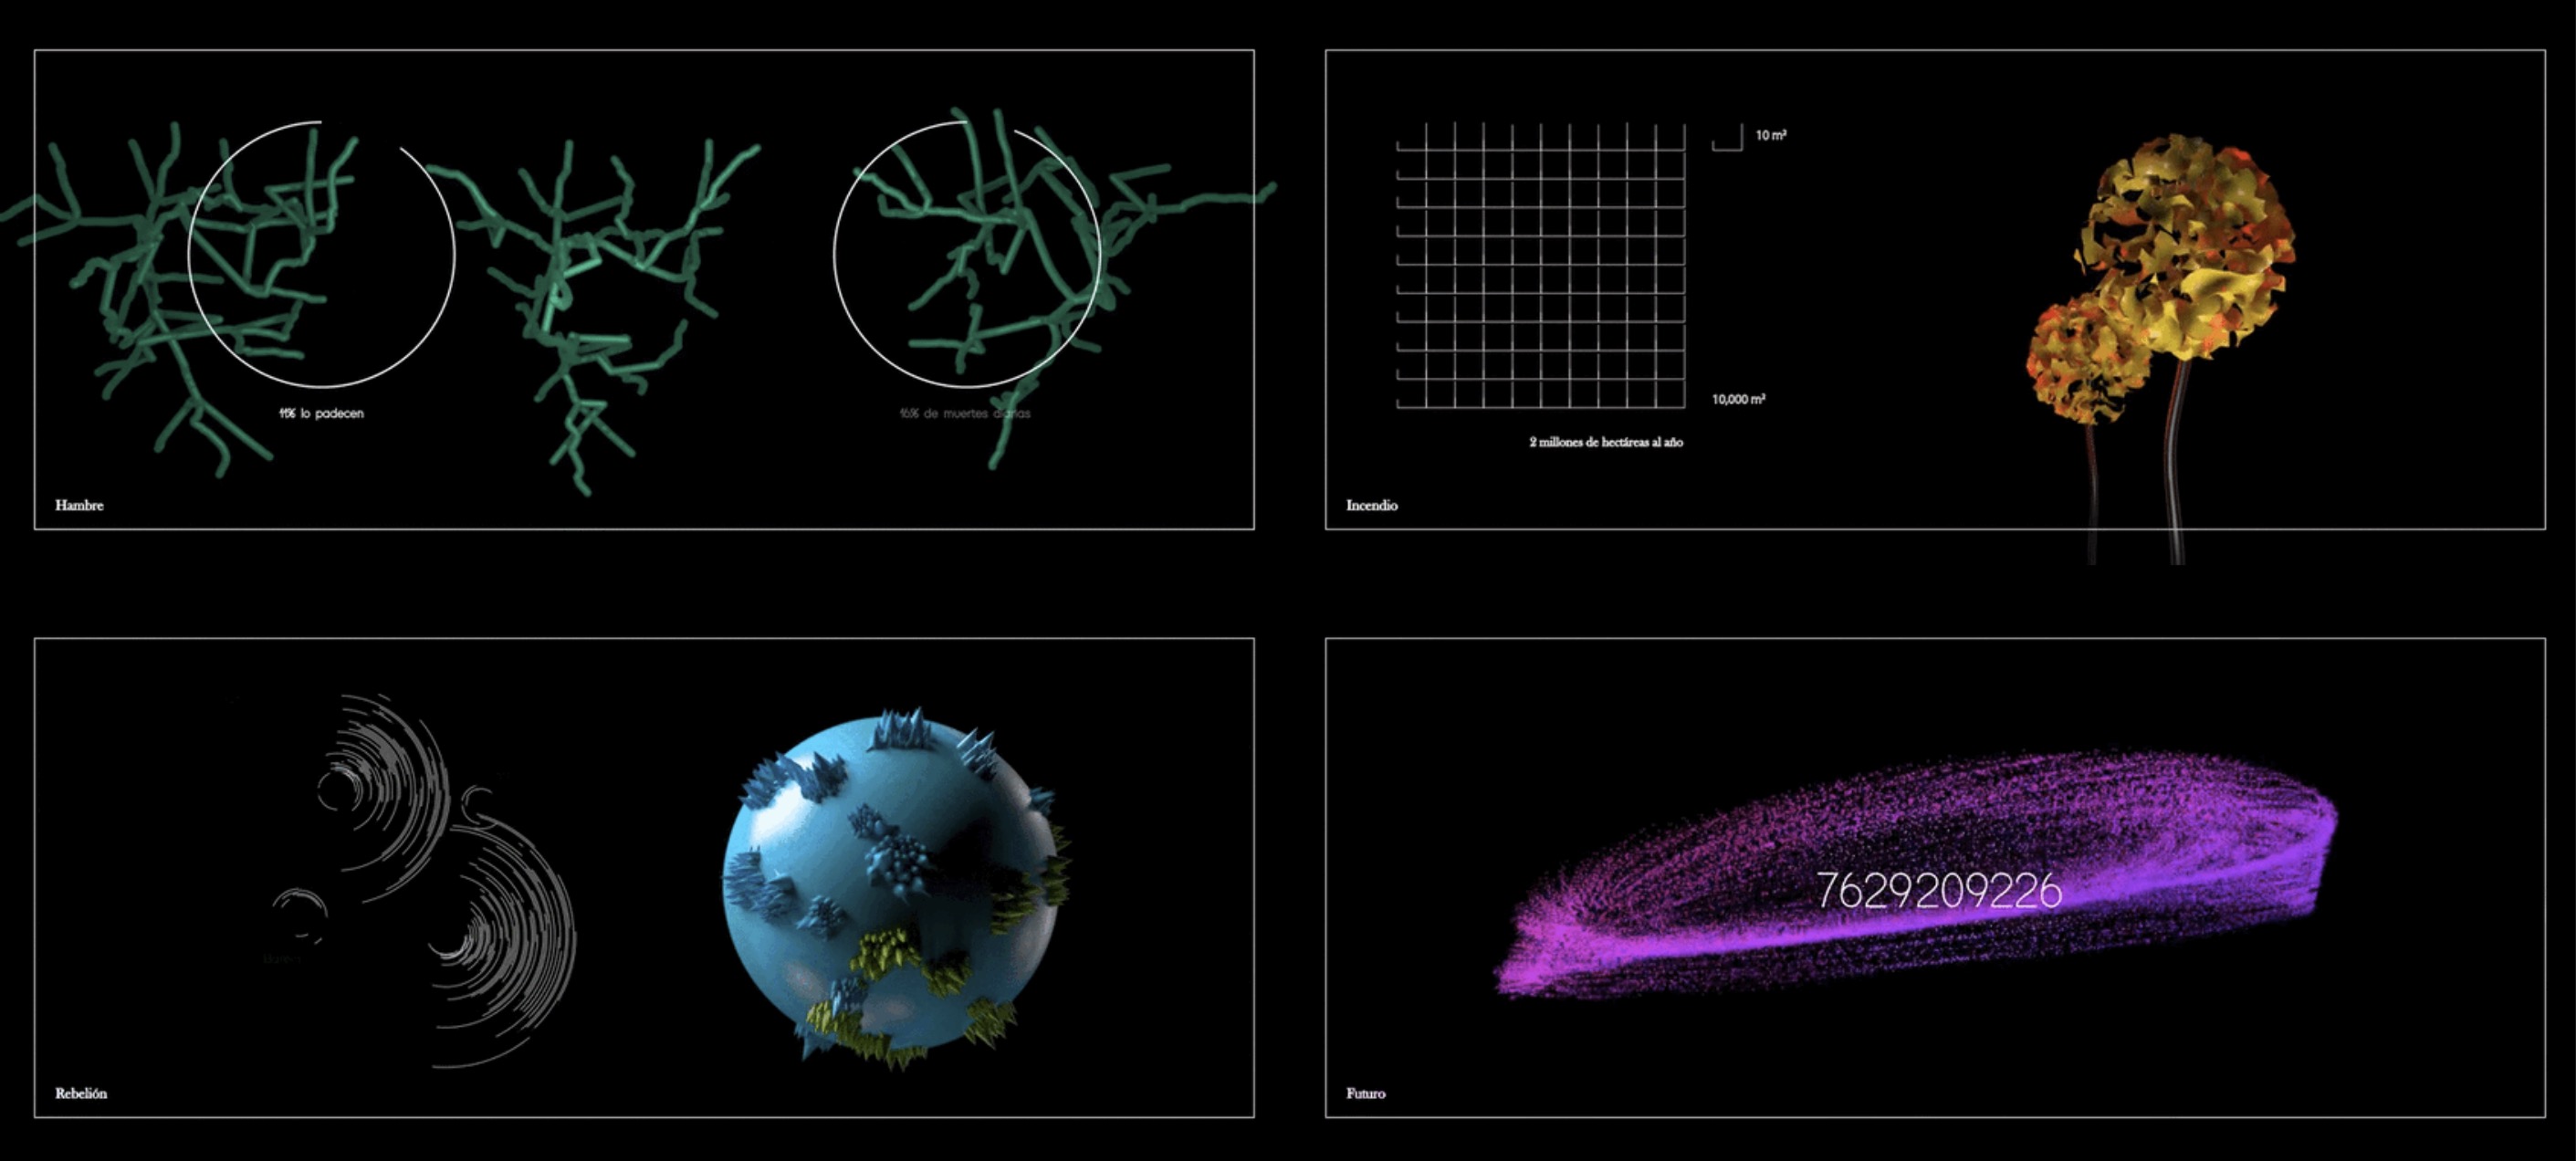
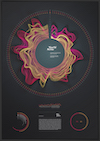
I think the way the data visualisation is being presented is clear as he pairs the 3D visualisation alongside the graph visualisation, which helps the reader have a better understanding of the data that goes into the 3D form.
Images: Héctor Eduardo Cabrera Flores. 2022.
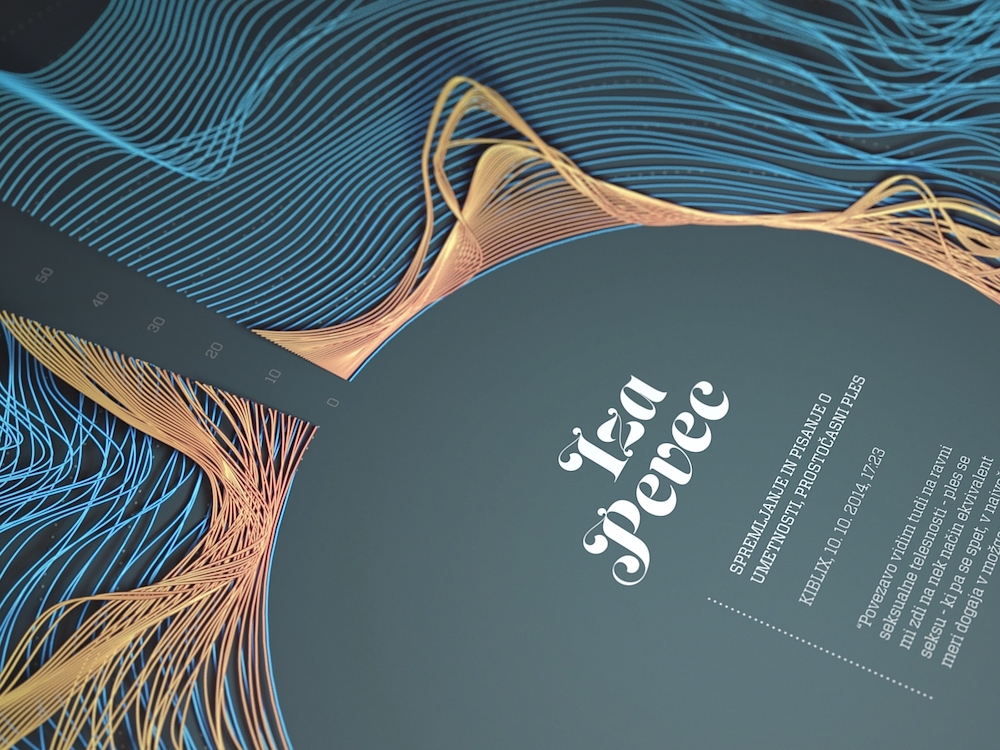 Braindance
Another project which I found was Braindance, which created this 3D graph visualisation, where the lines are slightly elevated and layered upon one another. I think this makes for a very interesting take on normal graphs. The layering of line graphs creates this illusion of depth in the visual as well, which makes the reading process more dynamic and visually appealing.
Images: Crtomir Just, matej koncan. 2015.
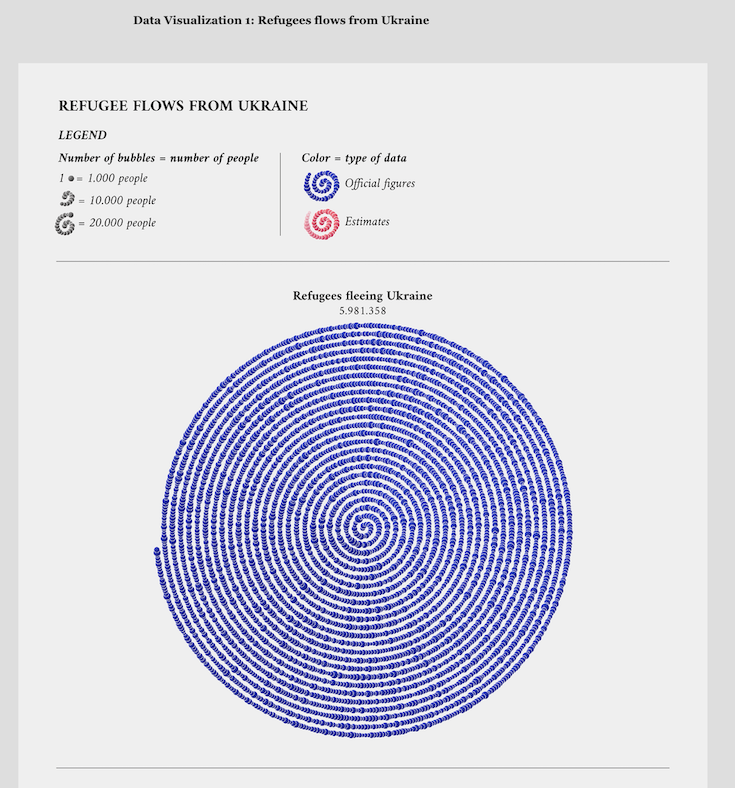
While browsing through my visual study, this data viz project by Federica Fragapane inspired me. It kinda looks like a fingerprint made out of data even though it's actually a visualisation for refugees in Ukraine hahah. The overlapping of circles here also gives this perception of distance and depth, which might be interesting in a 3D form. With this idea in mind, bringing back the suggestion Aditi mentioned back in week 4, using a fingerprint to connect the idea of humans and data.
Maybe I can do something with fingerprints, data, and 3D design?
Images: Federica Fragapane. 2022.
IDENTITY EXPERIMENT 1
Visualising emotions & tone of voice through 3D data objects
SHAPE
FORM
DENSITY
TEXTURE
In this experiment, I want to find out the influence of physicality in the representation of identities, does tangible forms of identity help to enhance the portrayal of the self?
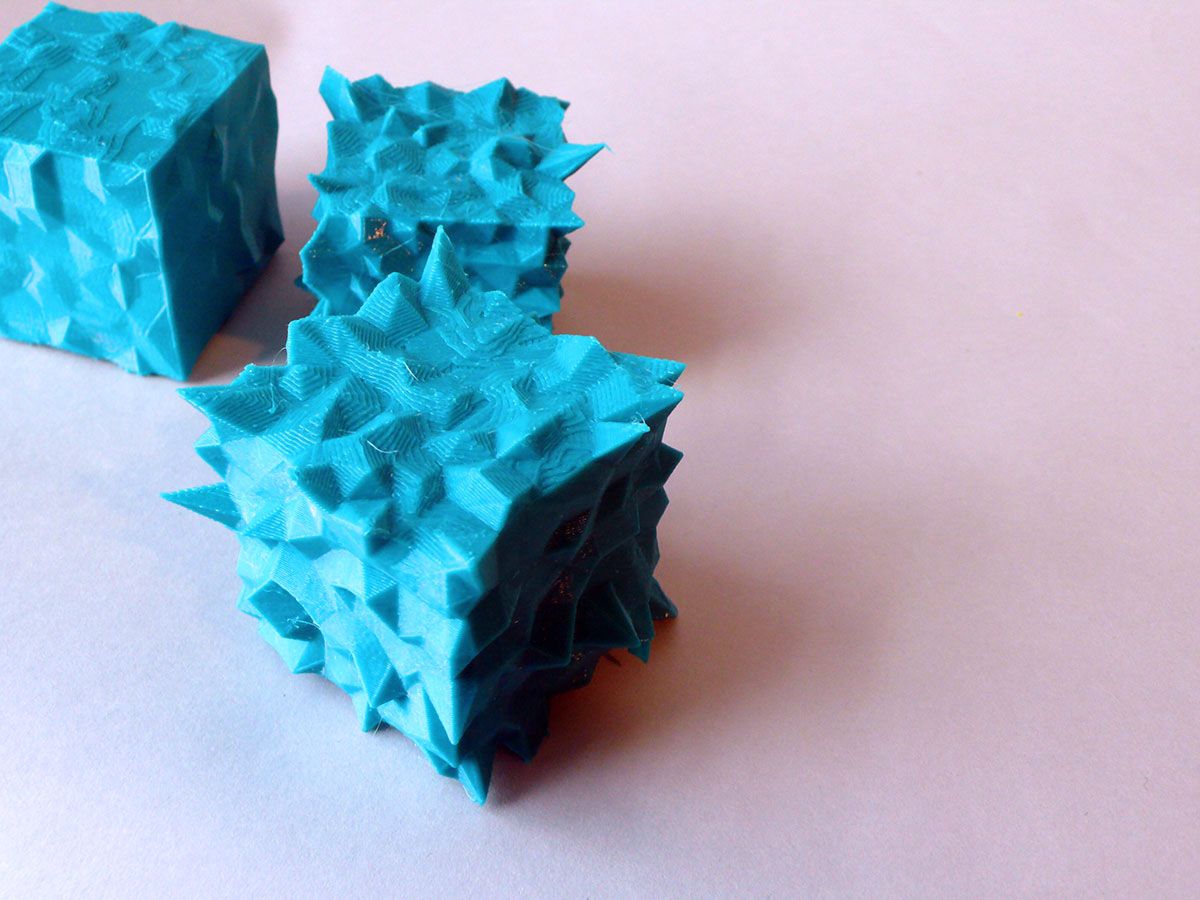
The sketches above show how I derived the initial ideas of the 3D forms, starting with the case study references from Data as Object & Poisonous Antidote I noticed that both of these 3D printed digital footprint visualisations use spikes to represent the data value. I wonder if there’s a reason behind the use of spikes specifically, is it just for the sake of legibility? Are there other ways of presenting data in other forms while still maintaining the comprehnsibility of the object?
I intend to create a series of different shape forms and texture to symbolise the characteristics of emotions and tone of voice.
The form and texture of the data object connotates the type of emotion and tone of voice as a way to represent the user's online voice
Sharpness of the shape represent loud and intense emotion and tone of voice
Rounded shapes represent soft and calmer emotion and tone of voice
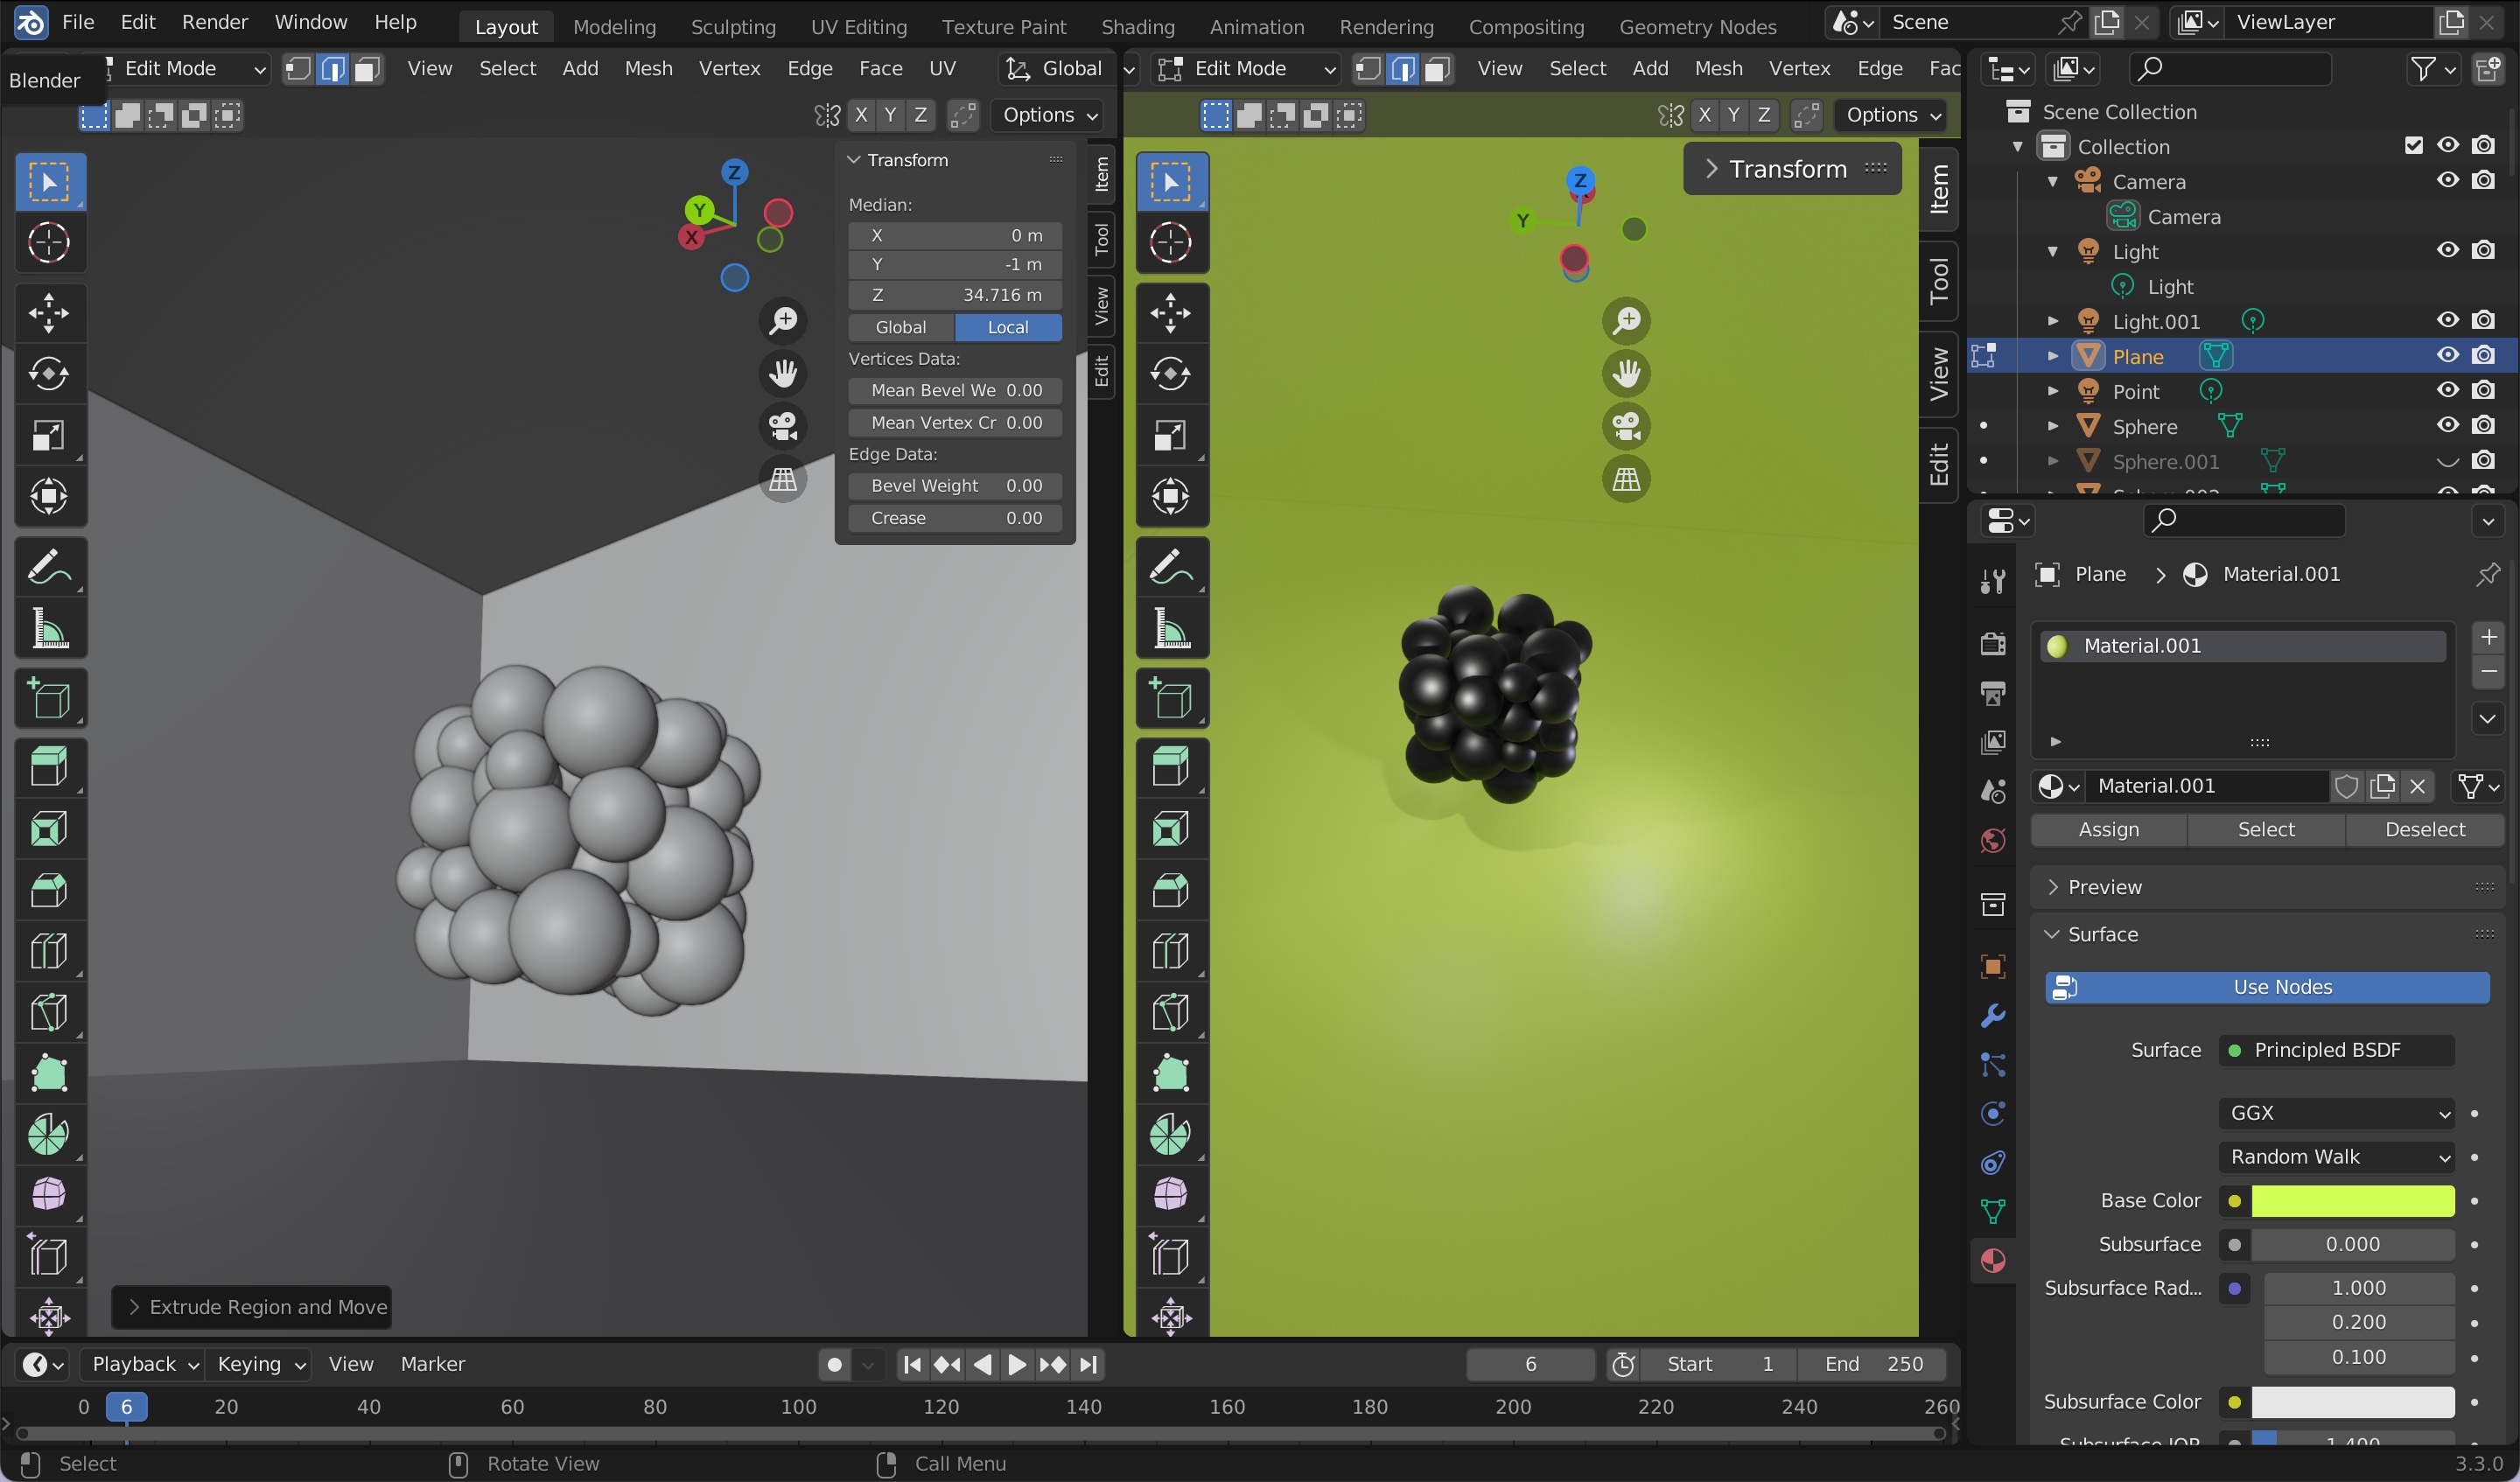
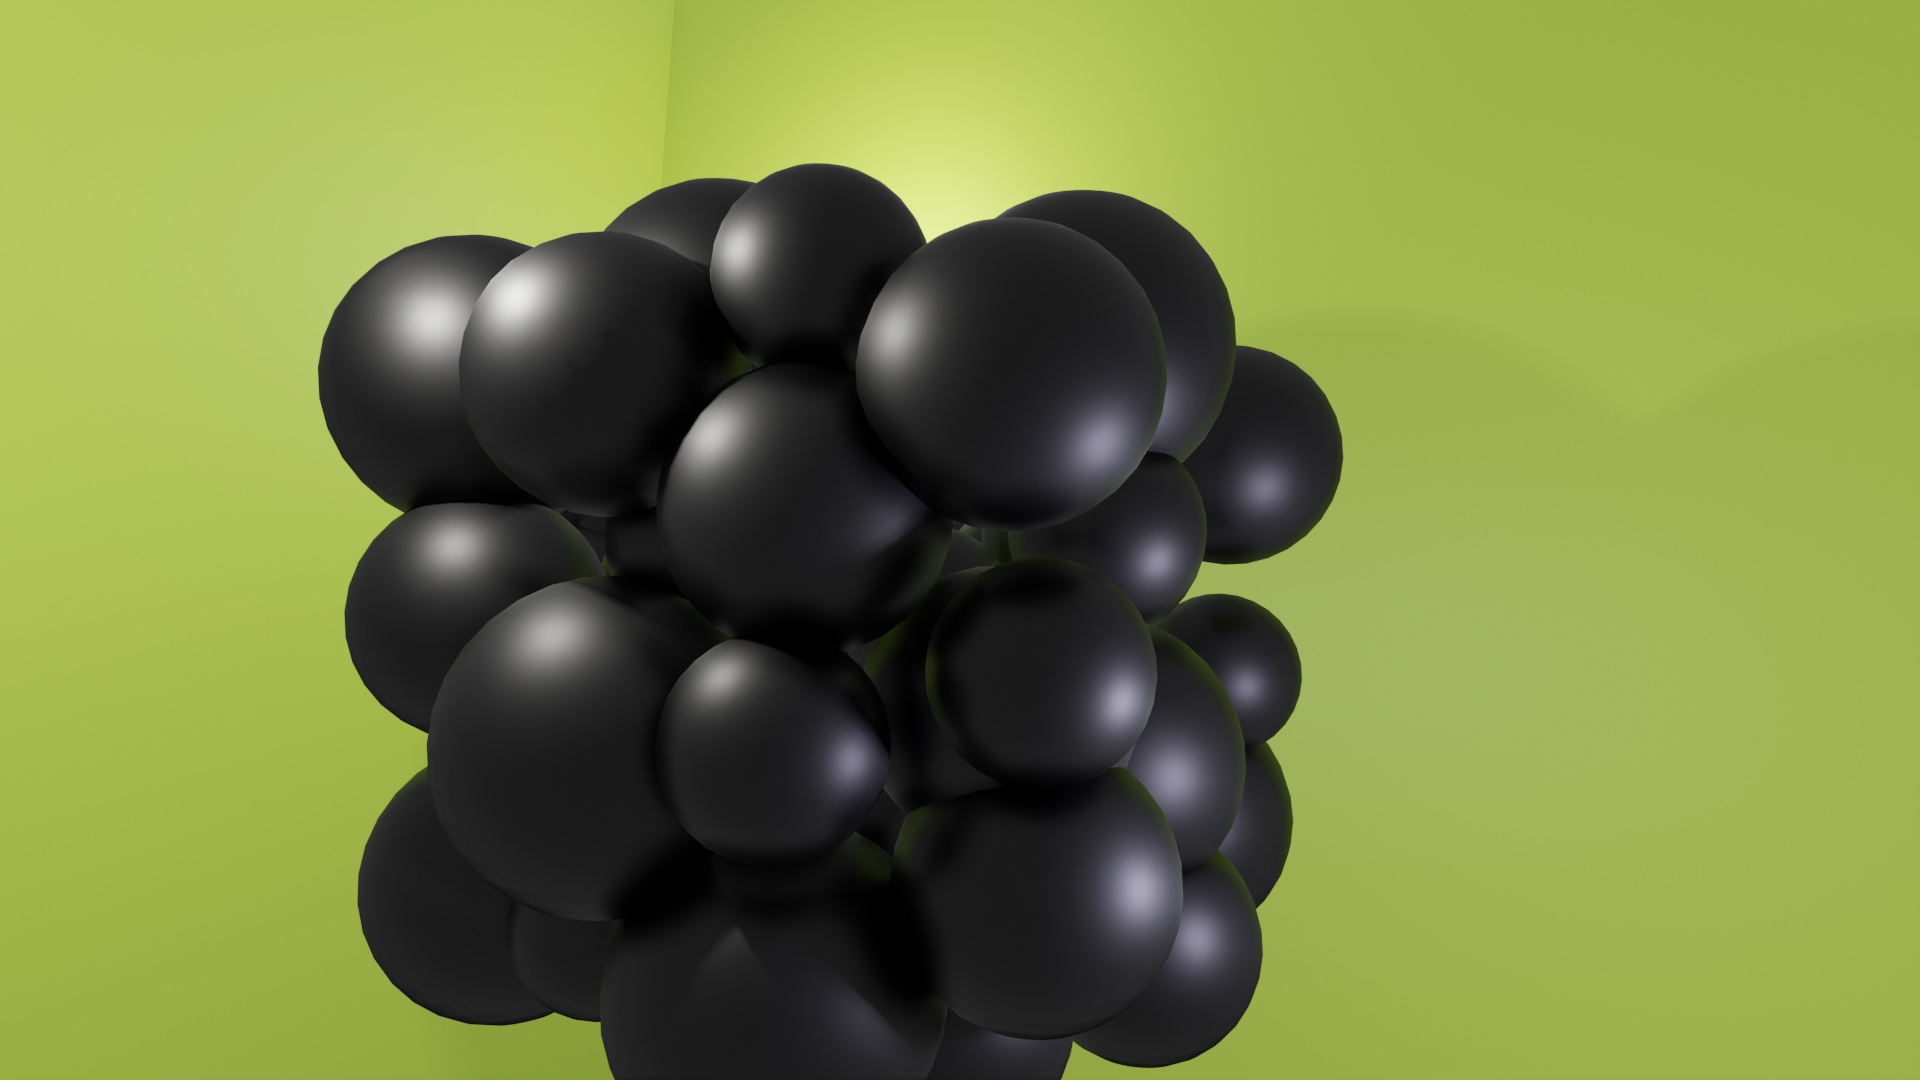
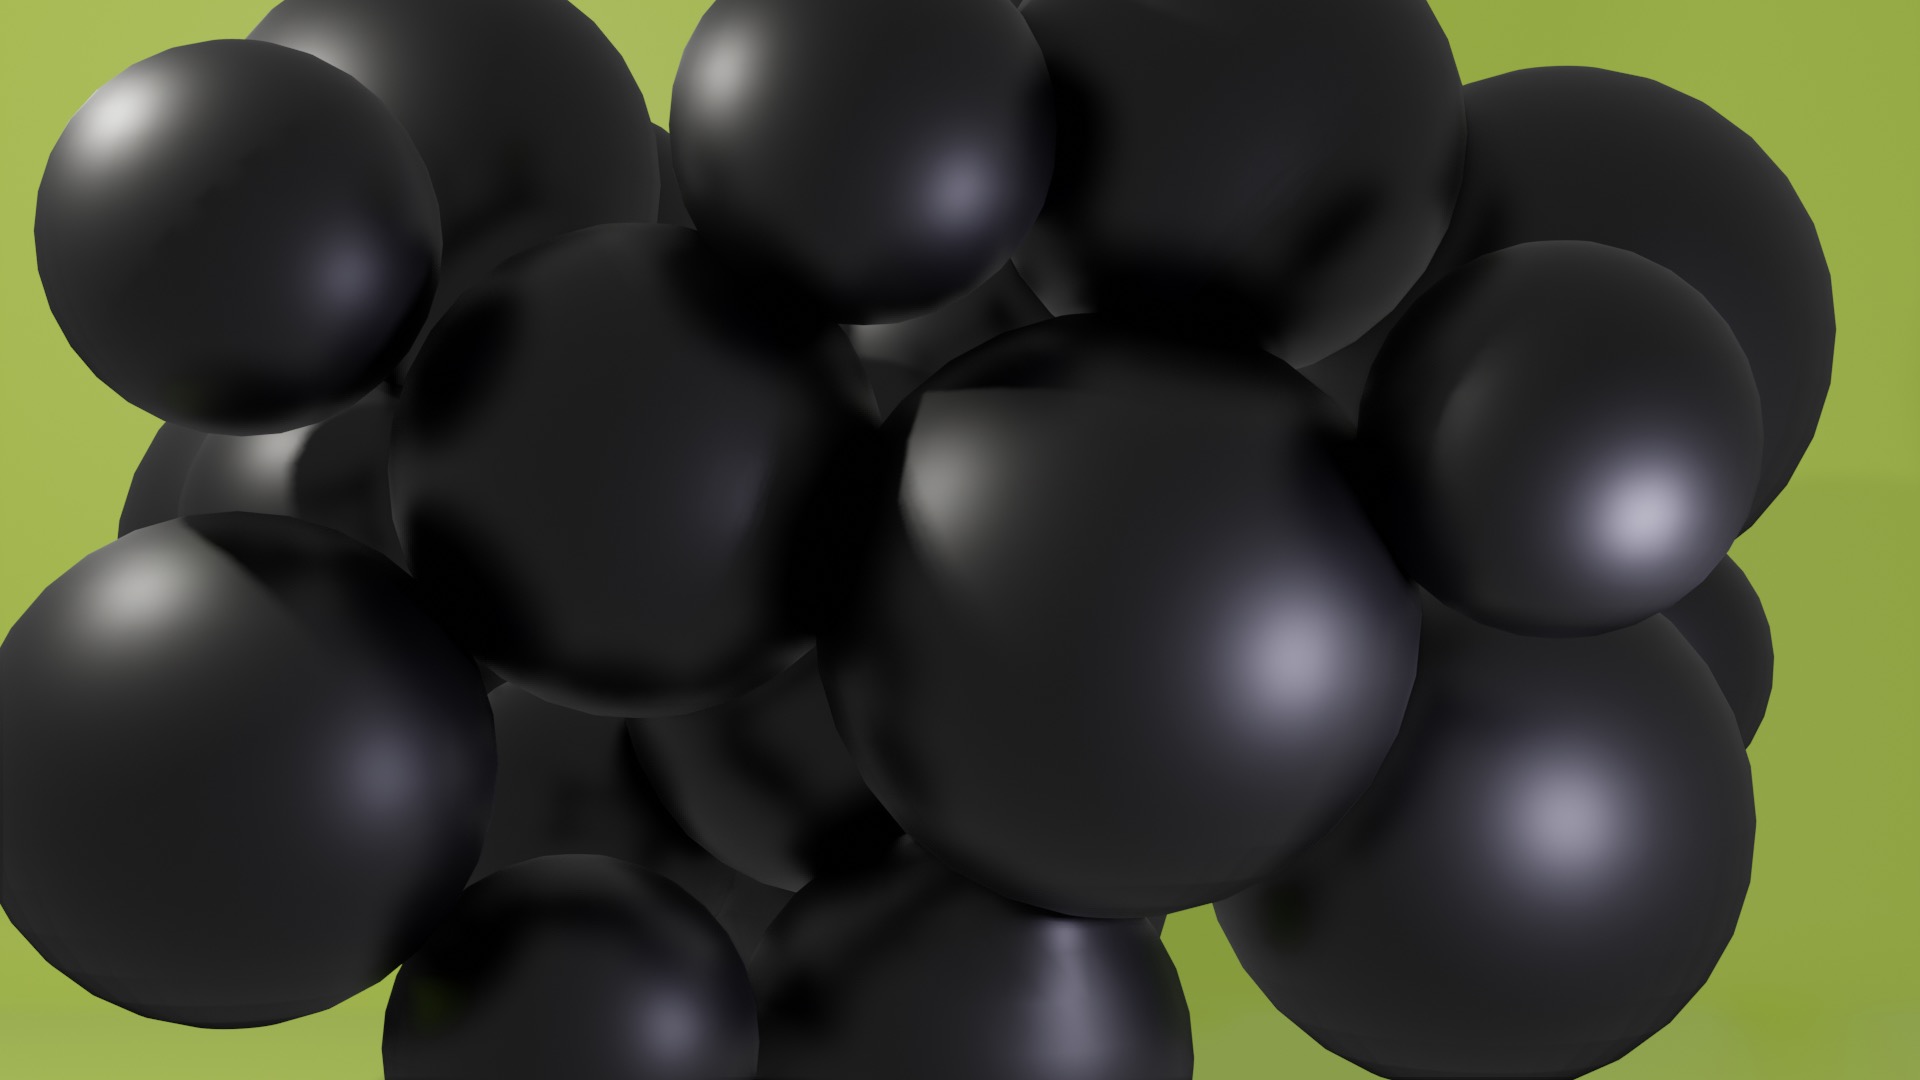
In the first 3D data object, I tried to make a voice representation through circles. Using circles with three varying sizes to create texture and mimic the complexity of emotions within voices.
As this is my first attempt at creating a complete 3D design, with planes, camera and lights to create a realistic landscape within the 3D space, there’s still alot of room for improvement, like the angle of the camera and lighting etc.
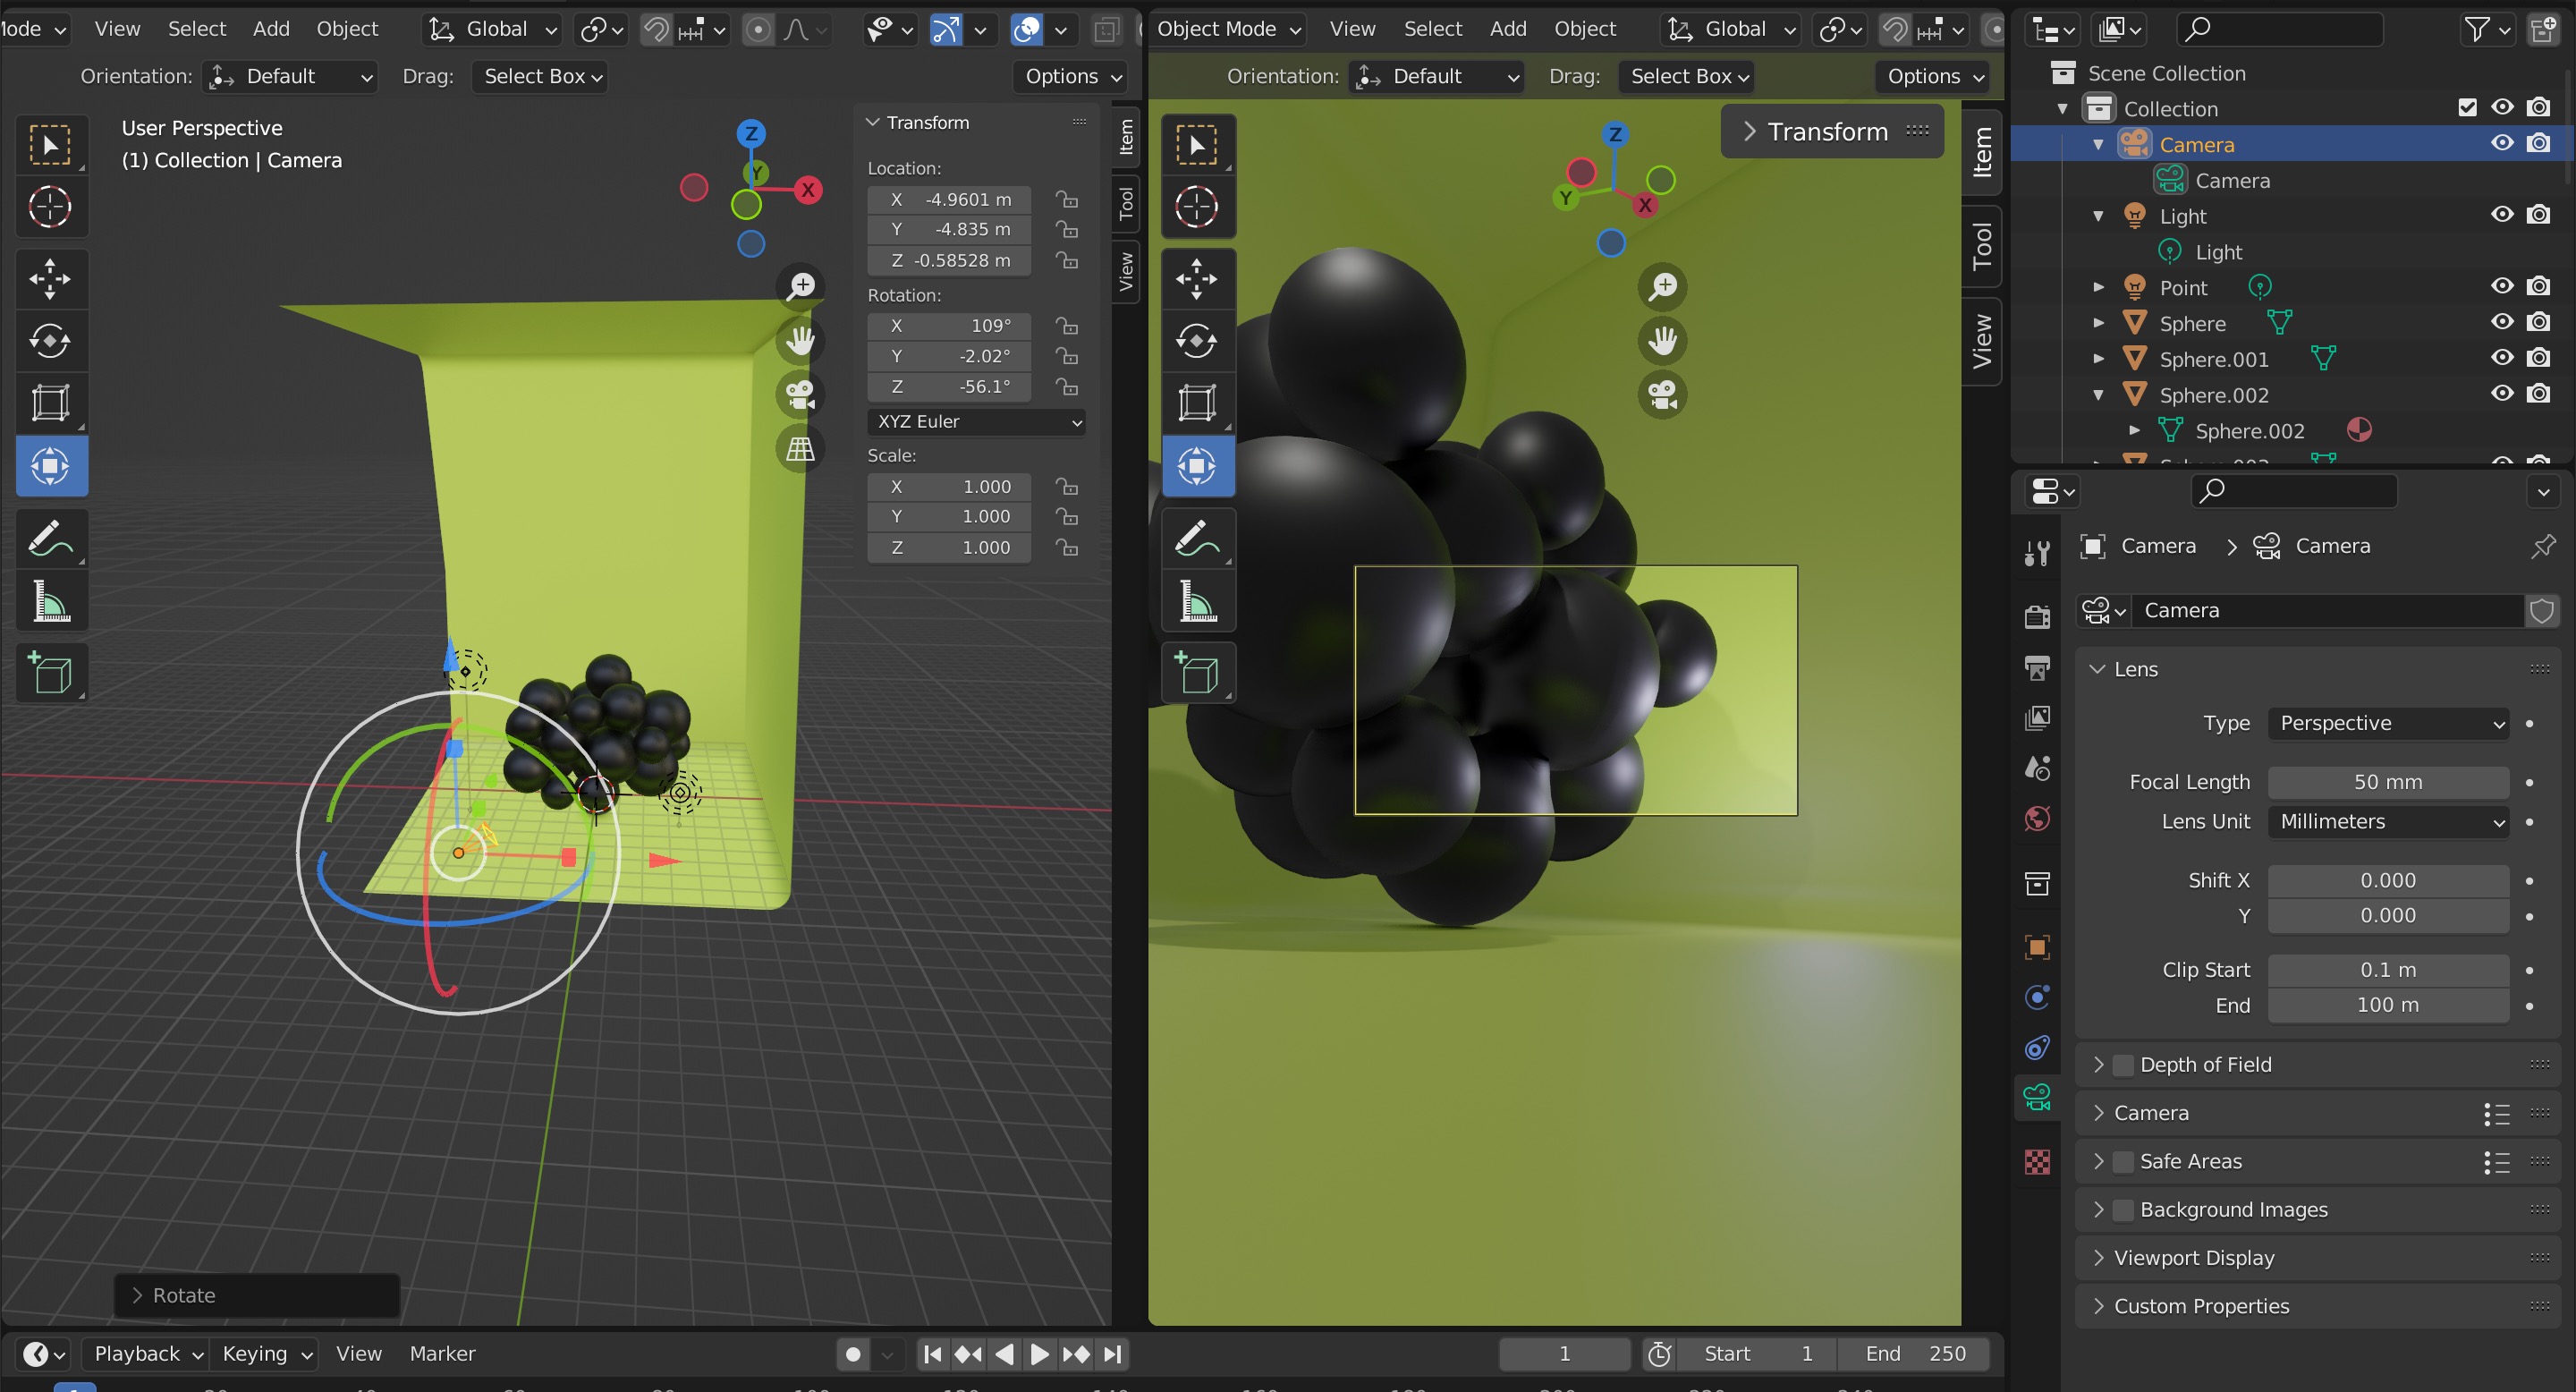
Still having lots of difficulty handling the camera, and controlling it to acheive the correct shot. Also the lighting was tricky too, as good lighting was needed in order to see the texture of the form.
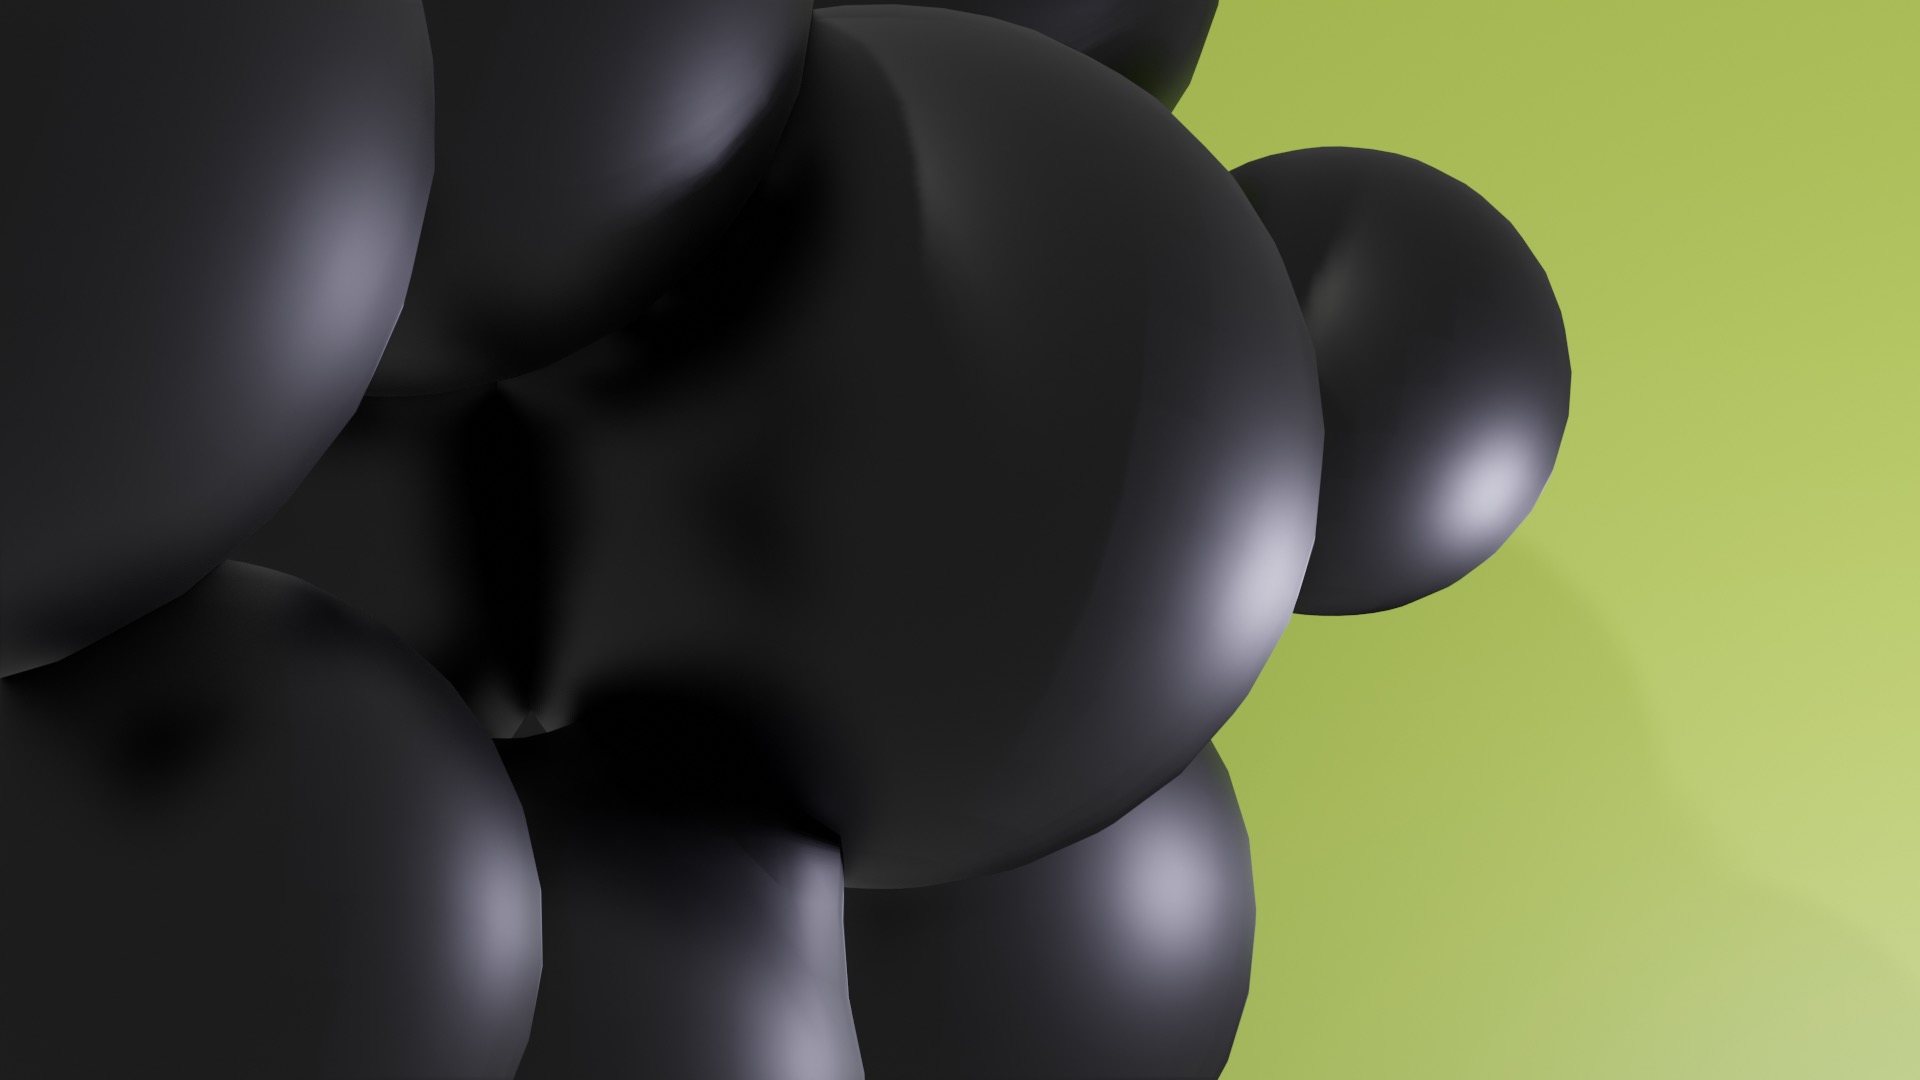
Considering this my first completed 3D render, I’m quite satisfied with this 3D data object as I think its an interesting form that can be interpreted in various ways.
For the second 3D data object, I wanted to try a different shape, using spikes instead of circles to create a representation for a striking tone of voice.
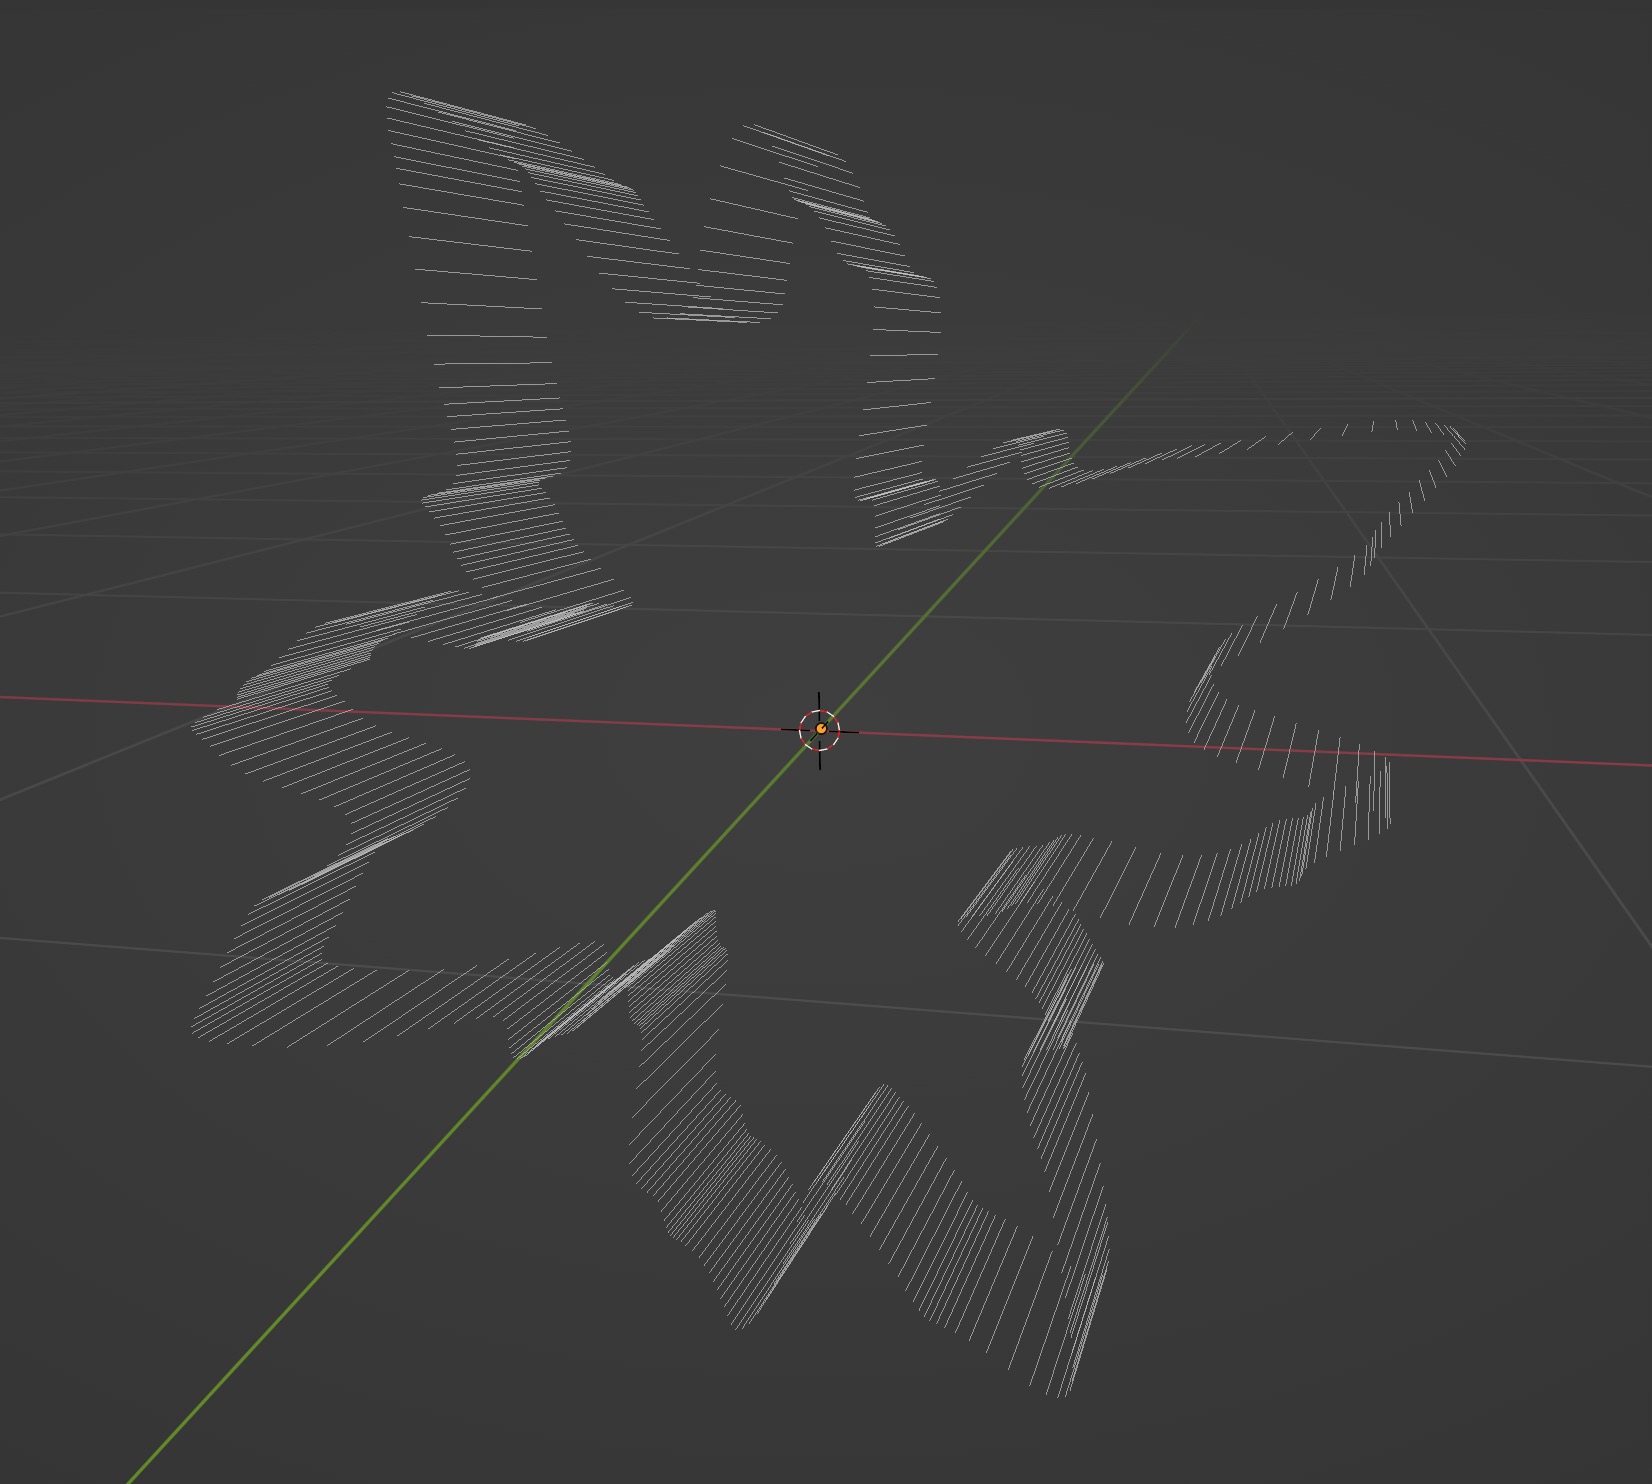
I tried to convert a svg shape from my code experiment outcome in week 6 as a base for the object. However, I ran into some problems as the object couldn’t be extruded from the svg.
Looking back at this test, I think what went wrong was that I tried to extrude the vertices of the svg instead I should have created a mesh first then proceeded to extrude the face or edge of the mesh instead of the vertices.
Retracing my steps, I went back to the tutorials and created a shape from scratch. This time I explored using the isophere cause the shape has lots of pointed and sharp edges which I could try to extrude from to create the spikes of the shape. Playing around with all types of extrusion and bevel functions, which achieved many interesting results, but not really what I was looking for.
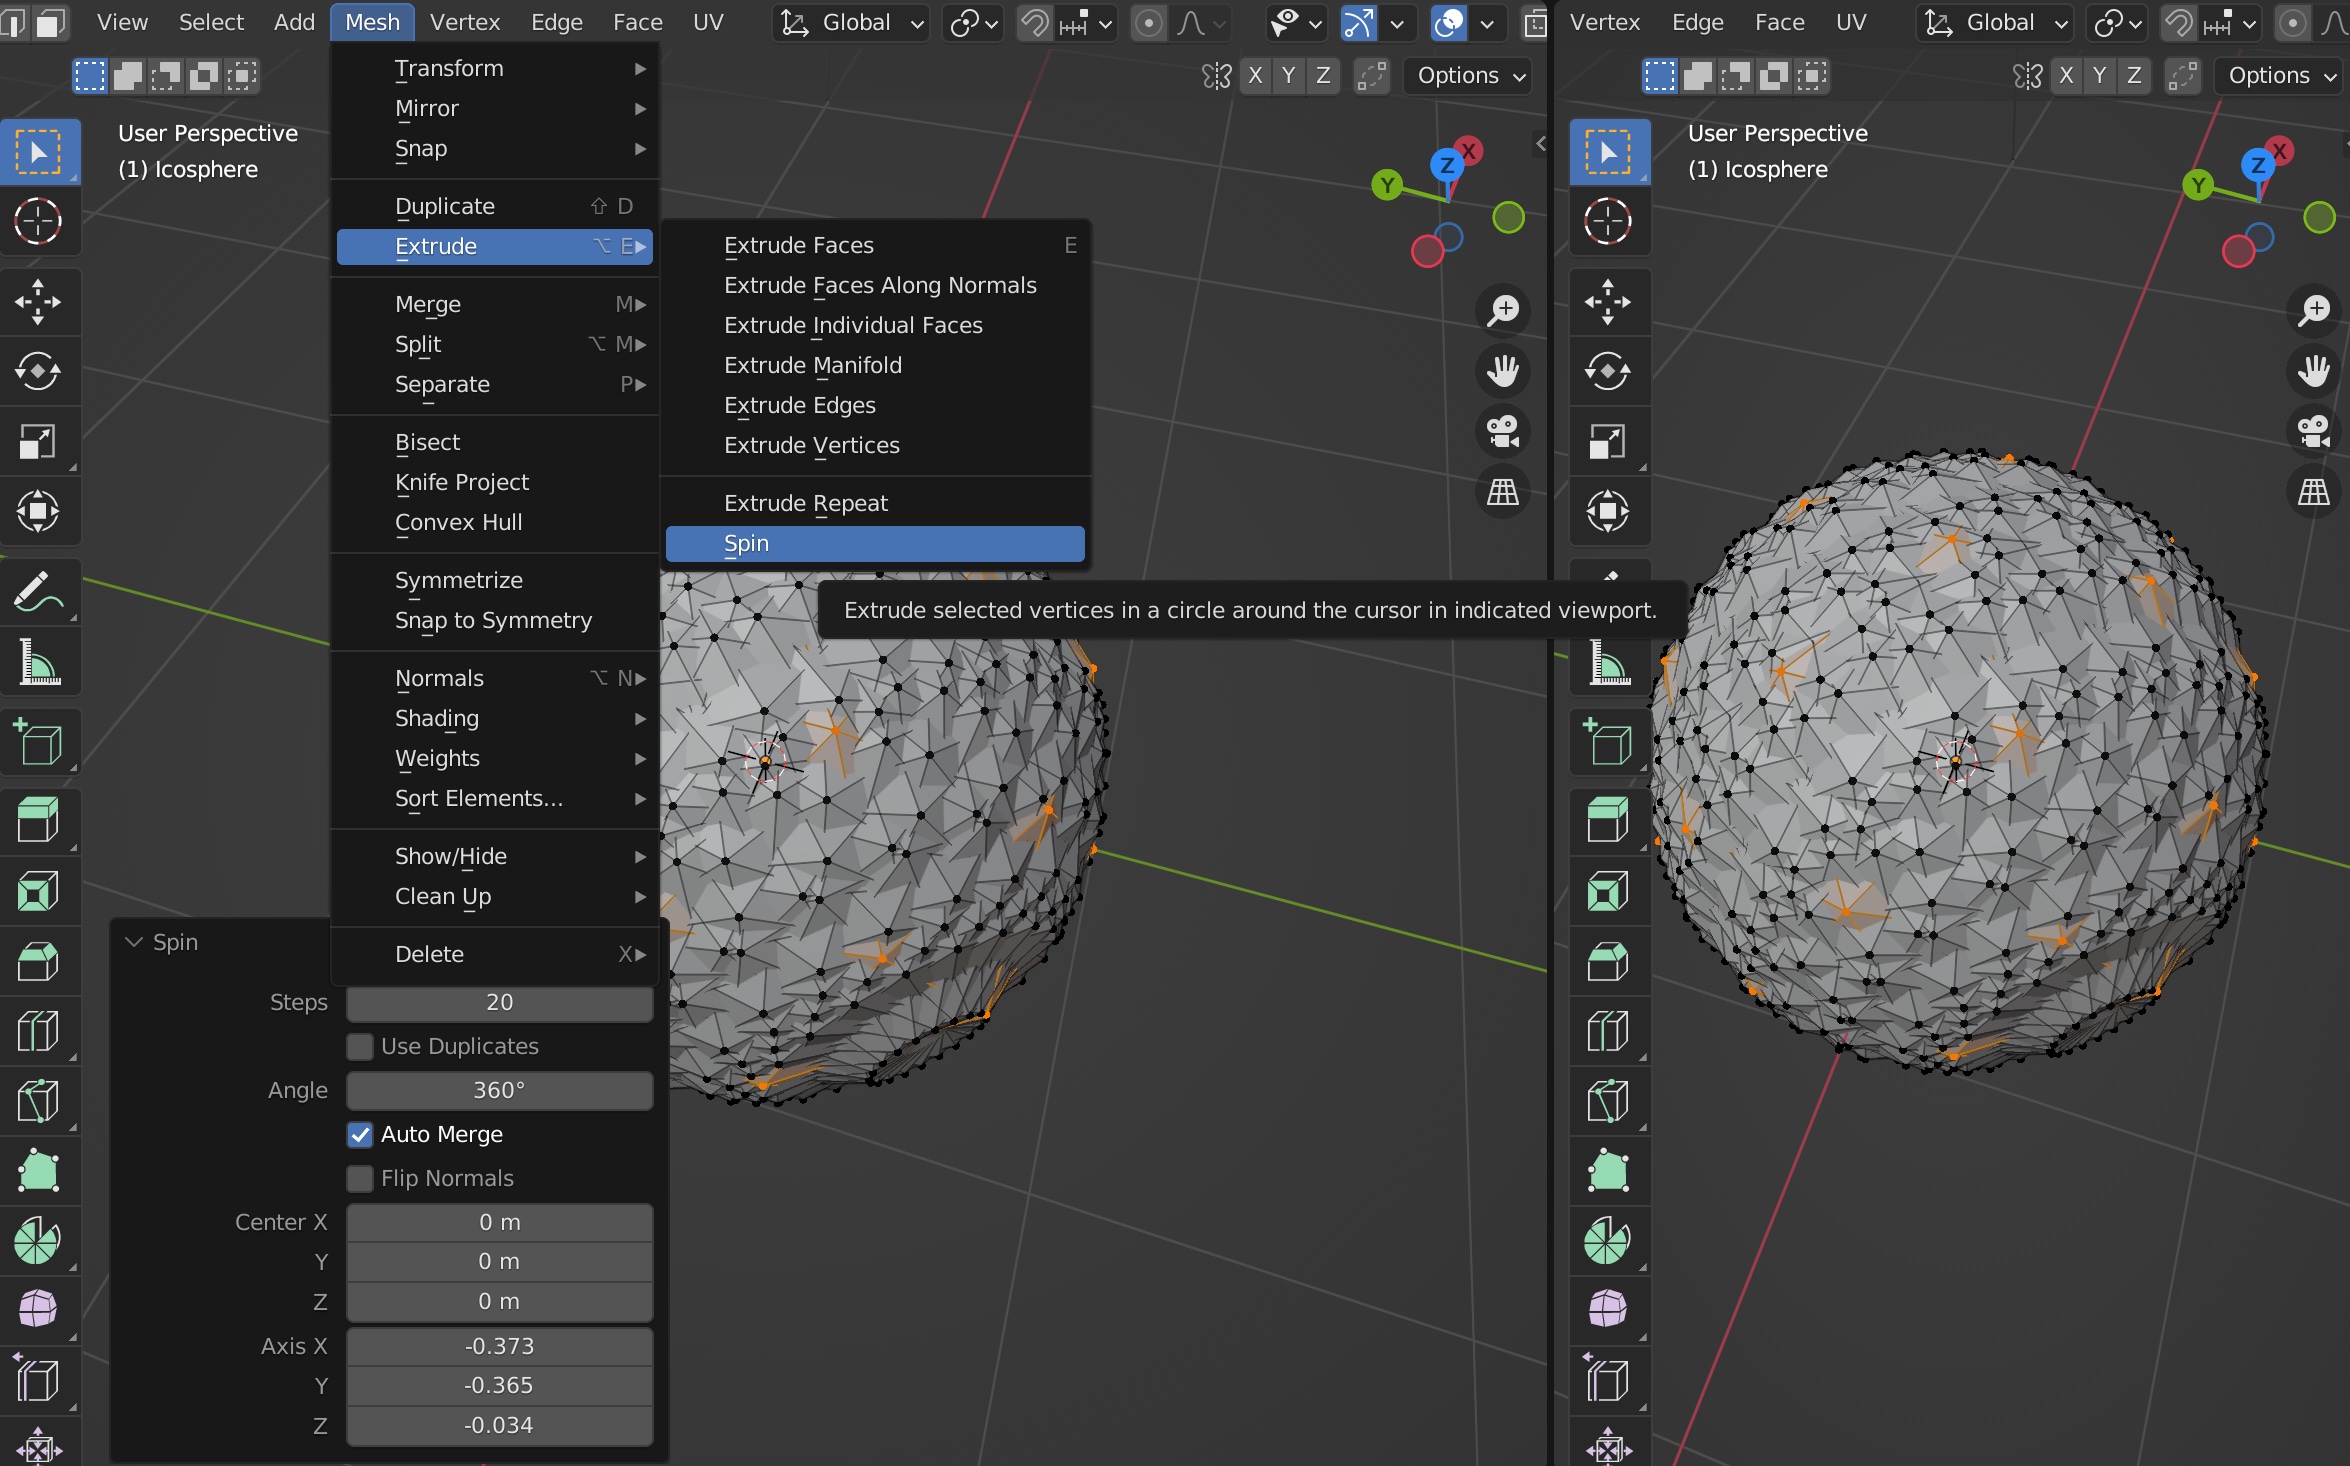
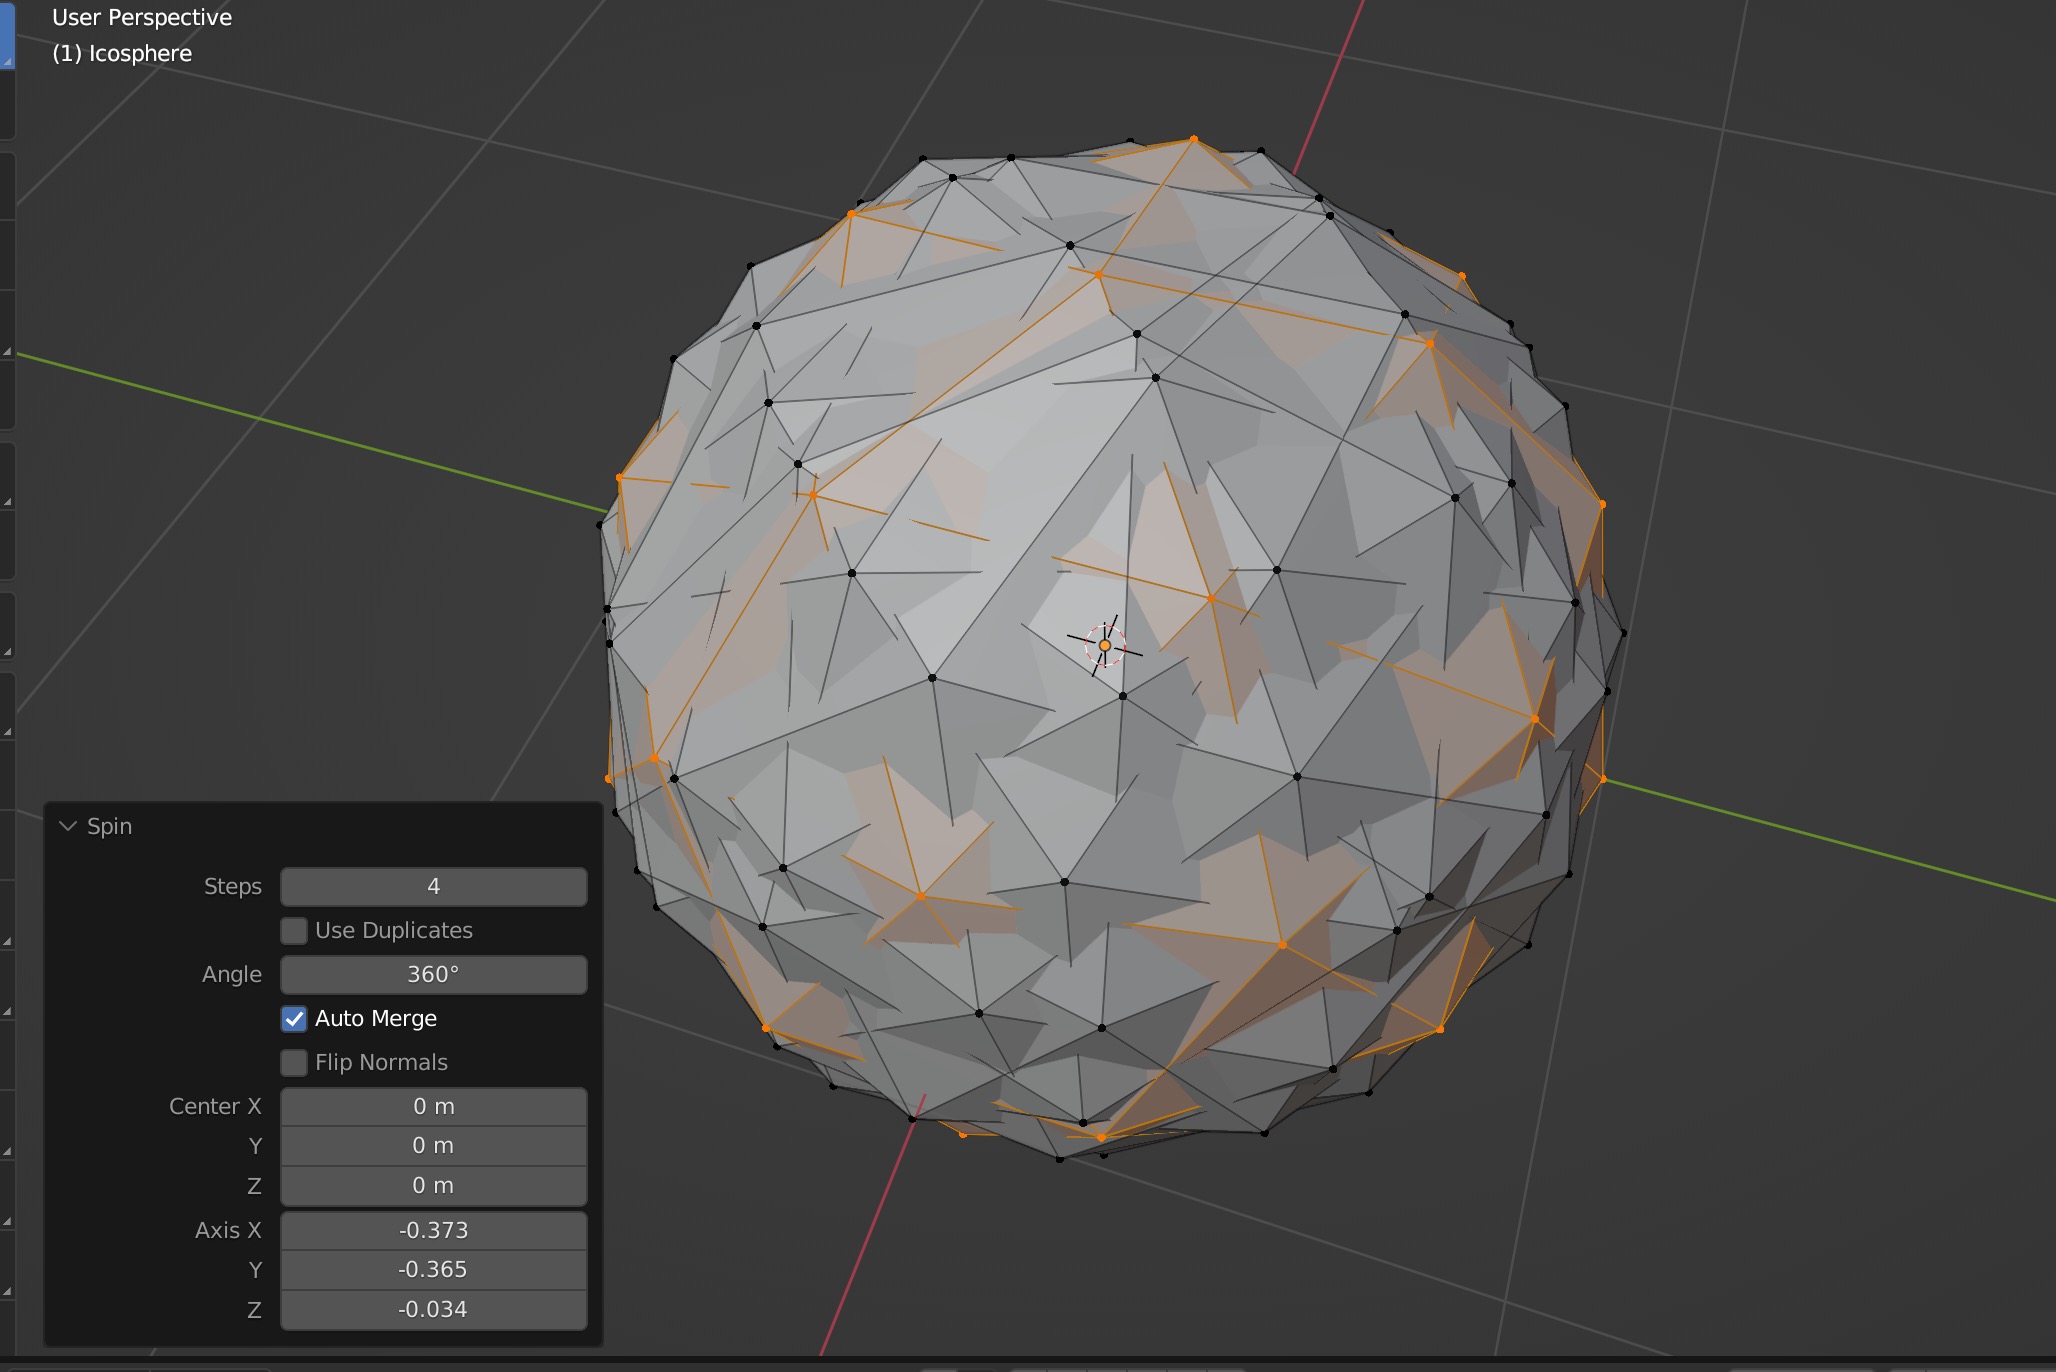
Finally, I found this function called ‘spin’, which basically extrudes the shape in a rotational format. This function made the vertices of the shape overlap and merge together to form a very texturized surface.
-
Using the same ‘spin’ function, but this time round with a star instead of an isophere, the sharp edges from the star resemble spikes as it is being repeatedly rotated and extruded.

For the third 3D data object, it was more of an unexpected outcome which I stumbled upon while playing for the different functions like extrude, bevel and scale.
In this third shape form, I basically used the inset function on the triangular faces which left the edges of the vertices showing, creating this lattice texture on the shape. By selecting the center points of each hexagonal shape and extruding the edge outwards, forming the star shape within the hexagon.
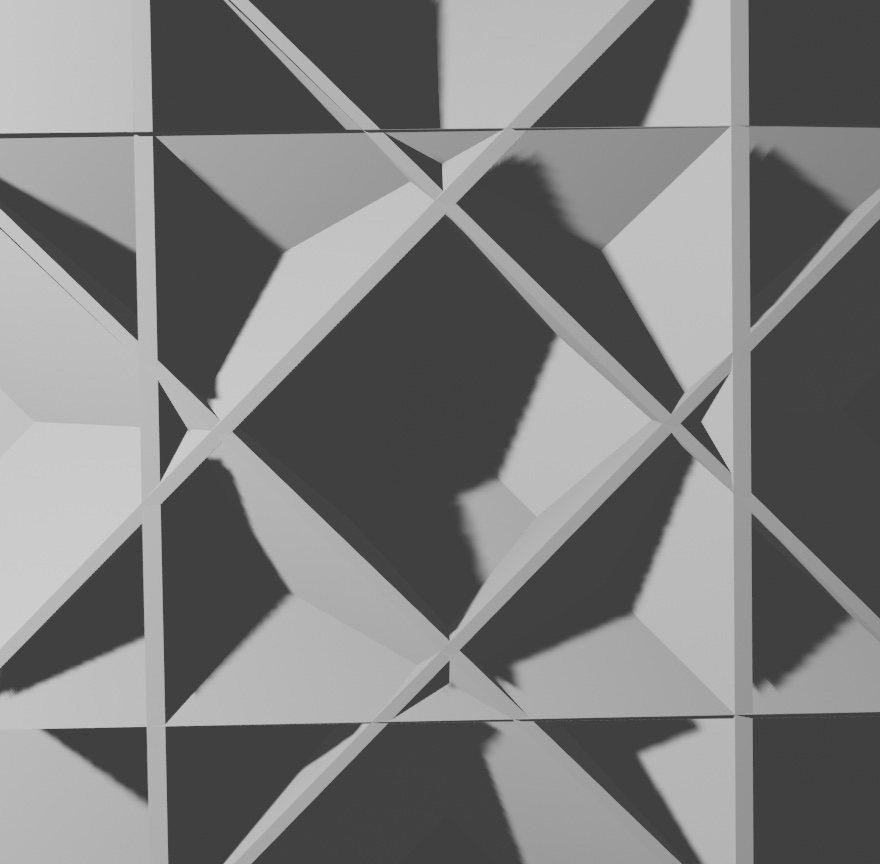
-
Here’s another shape form that was created using the same functions but with a cube instead. I thought the symmetry of the texture was pretty cool and this truly showed me the power of these functions in creating patterns with just a few value adjustments!
Sidetracking from the experiment for a bit as I explore how the displacement function works :)
While searching for tutorials on how to render animations to record my 3D data objects in the previous week, I found this tutorial by Ducky 3D , which uses displacement looping to create seamless animations. Through this tutorial, I became curious as to how he created this fluid shapeform, which led me to watch a few more of his tutorials on the functions of displacement.
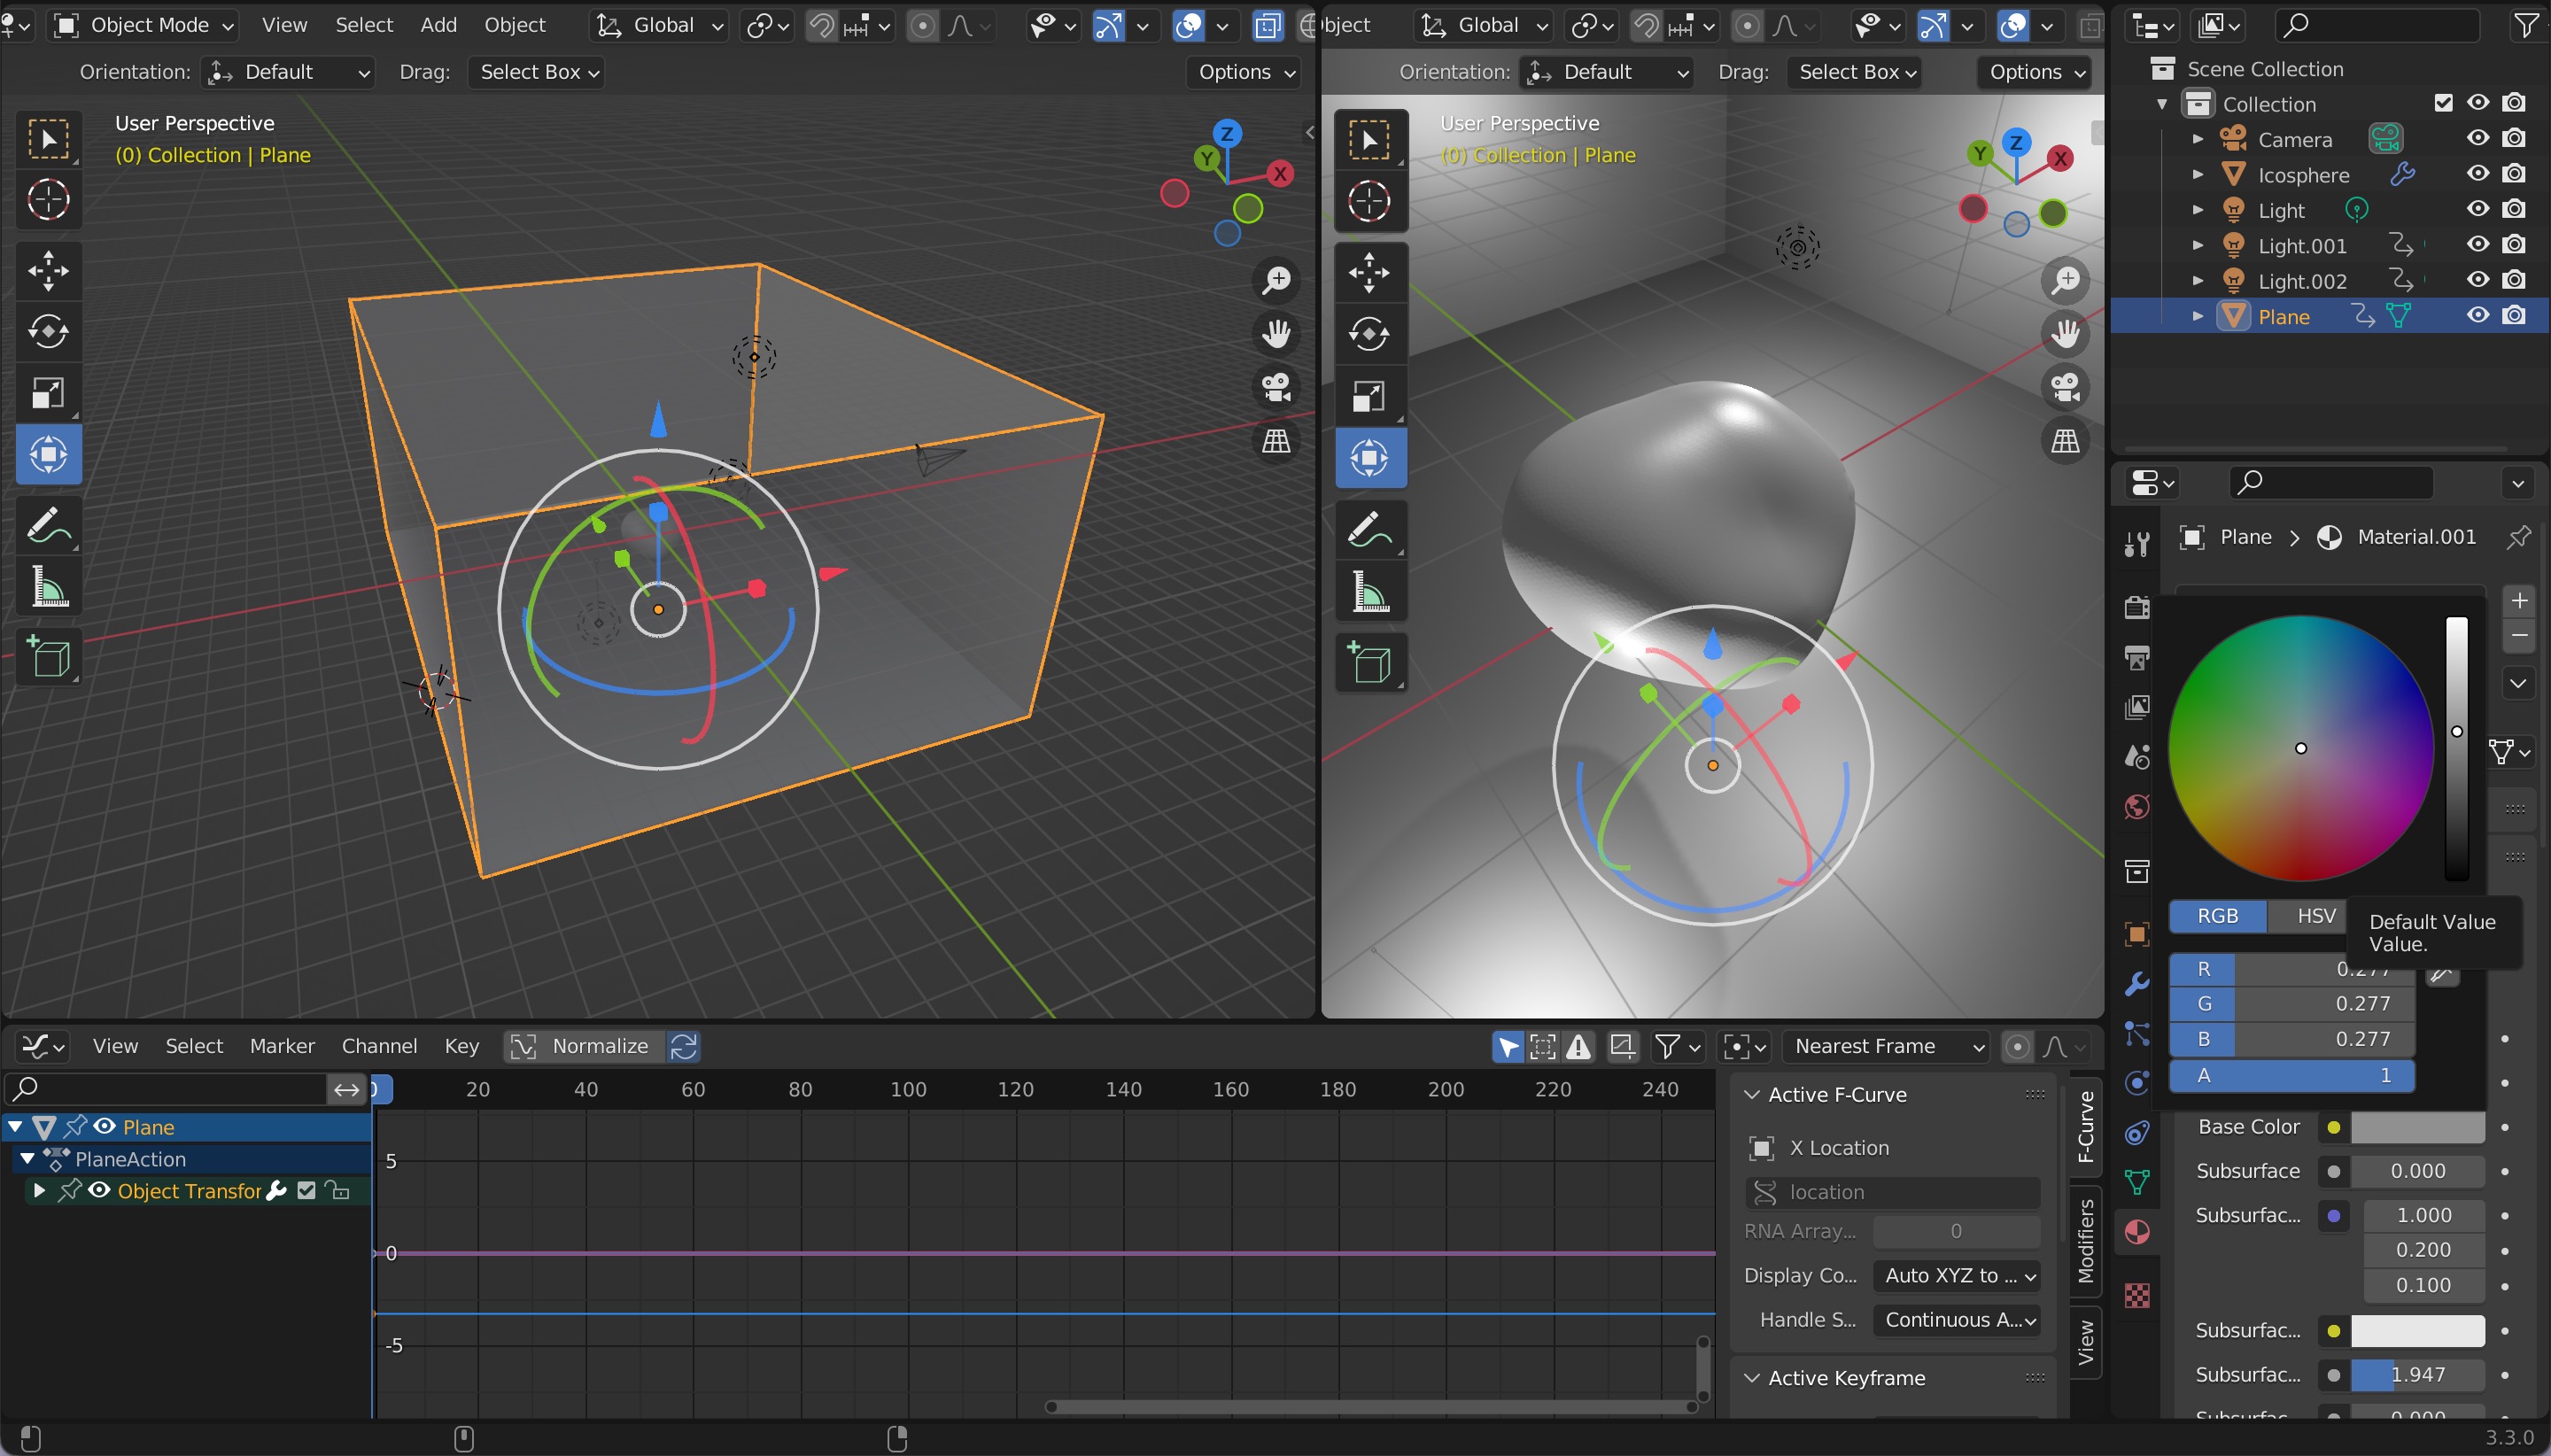

Experimenting with displacement has also thought me a lot about how to use materials in the render. Using the material properties to control the metallic, sheen values, etc to create a material that works with the background and lighting.
This also led me to learn more about the properties of light and shadows, and understand the relation between material, light, and shadows– how does shadow react with the material type? does it get casted onto the background? how does the light bounce off the shape? how can I illuminate the texture more effectively?
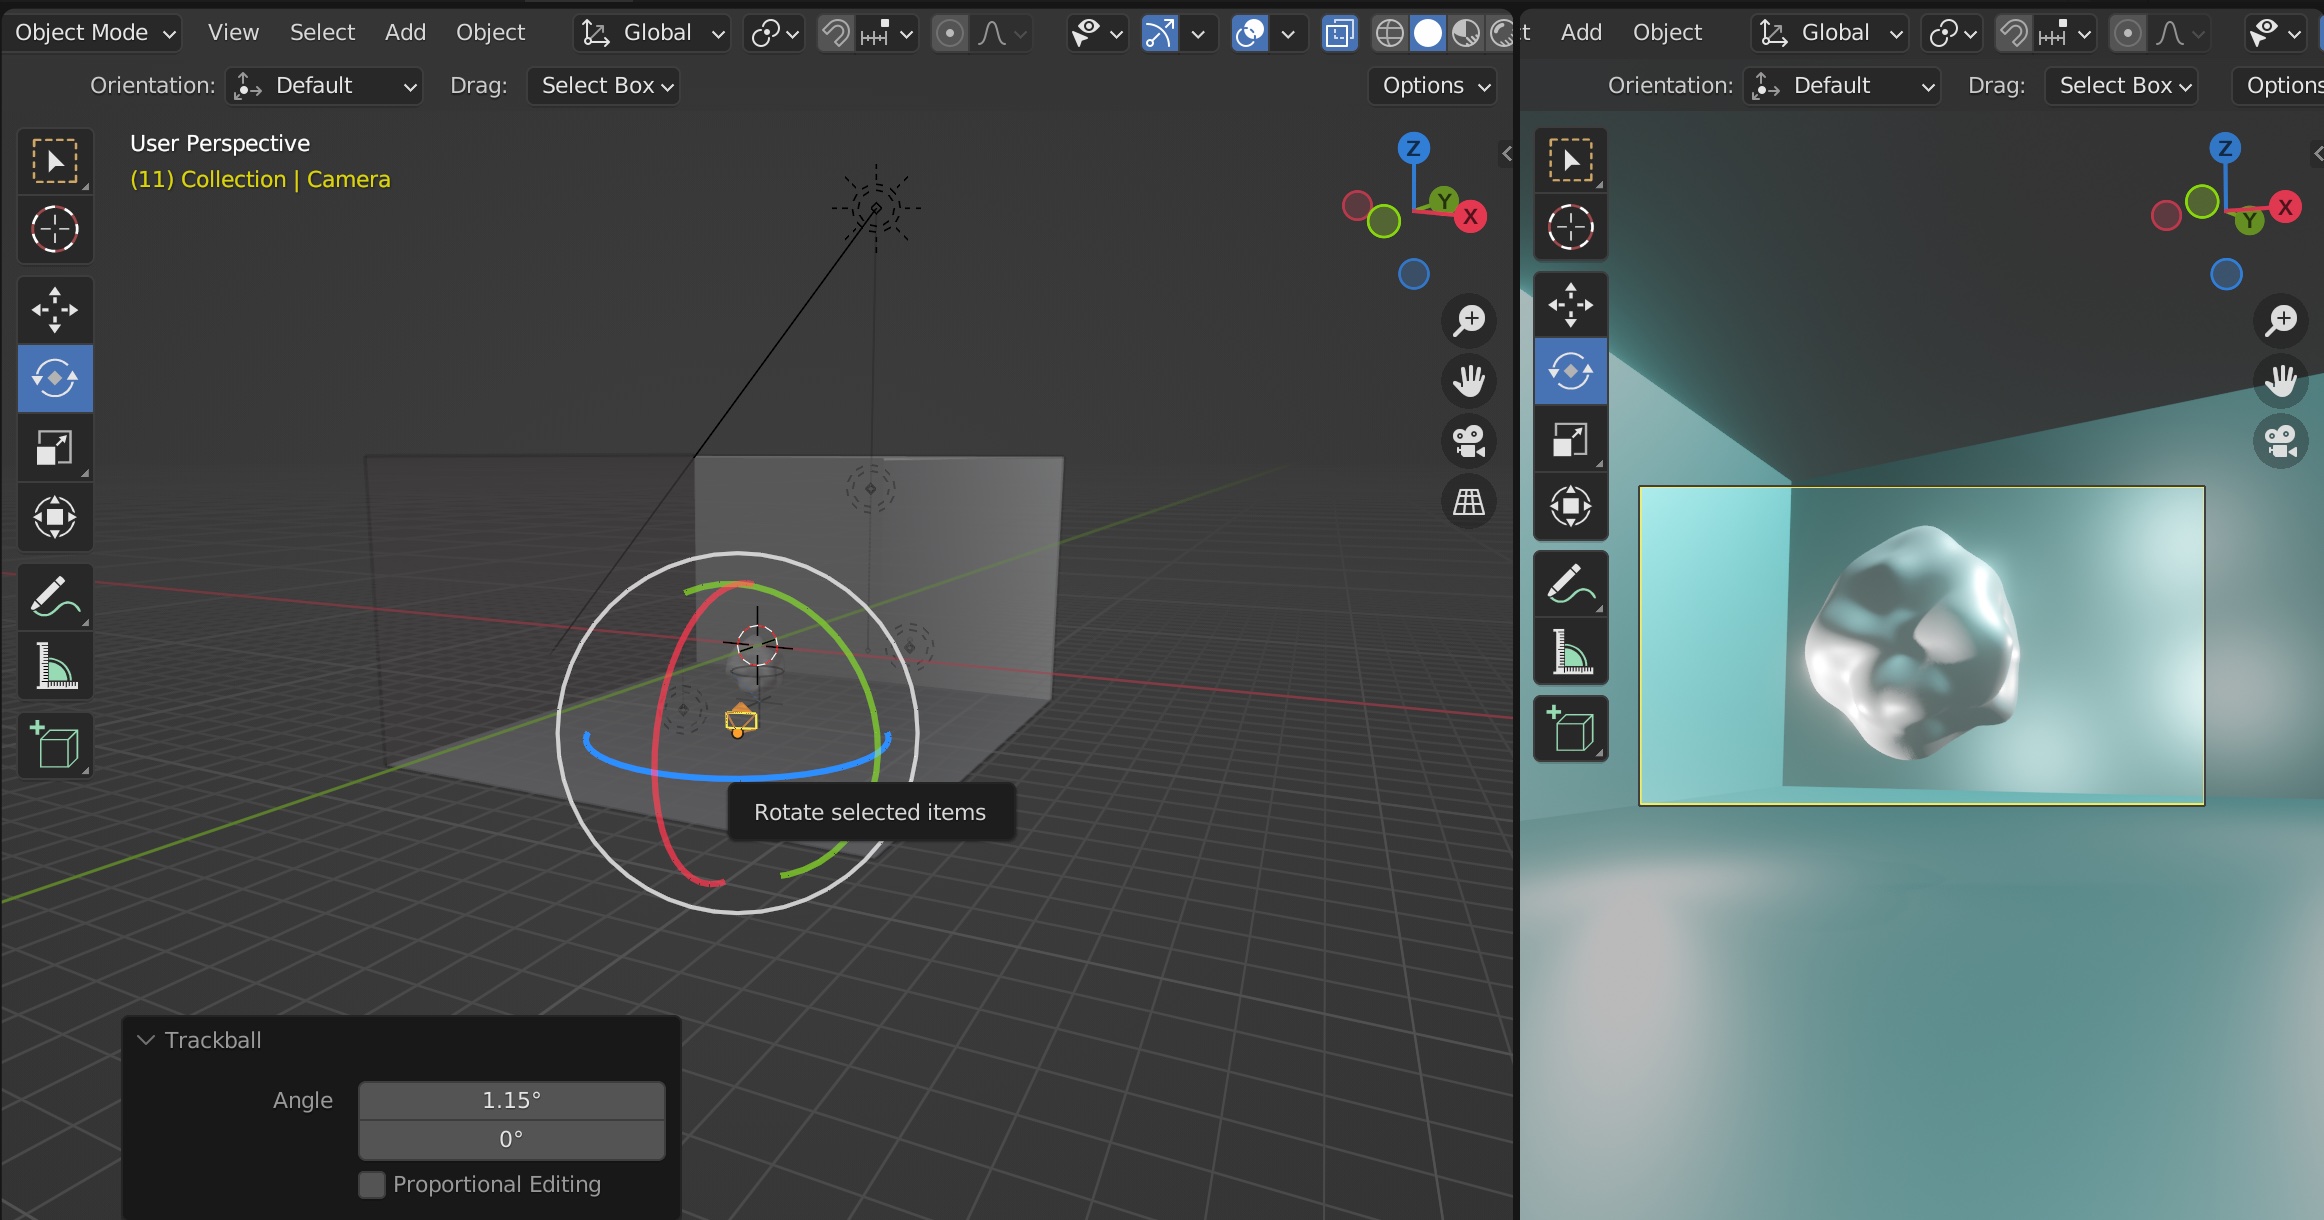
The end result–I added colour onto the background and made the material of the 3D object slightly metallic to have the colour of the background reflected onto the surface of the object while it moves. I added a rotation keyframes at the start and end of the animation to loop the movement of the shape, which also helps to create this illusion that the shape is evolving or transforming. I also increased the ‘sheen’ values so the edges of the shape glows as it moves to highlight the contrast between the ridges.
For the fourth 3D data object, I thought of creating a shape that was balanced between the first and second, a more playful and fluid shapeform.

Putting what I learnt about displacement functions to use, I tried using this function to to control the vertices. For this data object, I used the wood texture, combined with noise basis to create this wavy exterior that is a mix of rounded + edgy.
Here are all the shapeforms I have done so far, I tried to create a range of shapes and textures to illustrate the different traits of emotions and levels of tones in our online voices.
At the end of the week, after creating all these 3D data objects and familiarising myself with the camera, lighting, world properties, and render options, I revisited the first 3D data object and redid the render to optimise the quality of the shot.
