1 / Arduino Tutorial
2 / Mindmapping Ideas
3 / Code Experiment 6
4 / Peer Sharing
LED LIGHTS–ARDUINO TUTORIAL
On Monday, I sat in for an Arduino workshop conducted on LED lights with Sadhna. As I didn’t know much about Arduino, I attended the tutorial to gain a better understanding of what are the areas and potential of Arduino and hopefully get some inspiration from there.
To control the on and off of the LED lights, there were multiple ways to do so, some methods which I recall from the tutorial were weight sensors, reed switches, infrared sensors, light-dependent sensors or manually using the wires.
and communities there are, then start picking out which you would like to work with
To simulate weight sensors:
Place two wires with foam in between, and when the wires touch, it turns on, when the weight releases, the two wires don’t touch, the switch turns off
To simulate reed switches
Use a magnet to close the circuit, the magnetic field in this case acts likes the controller to on and off the LED lights.
Infared sensors
Light dependent sensors
Andreas also shared a website called 'Feltron' with me, which I thought contained lots of useful examples of different forms of data visualisations–how data visualisation can be done as a report, infographic and publication format. I feel like this gives me a fresh perspective after so many weeks of focusing only on data visualisation through code.
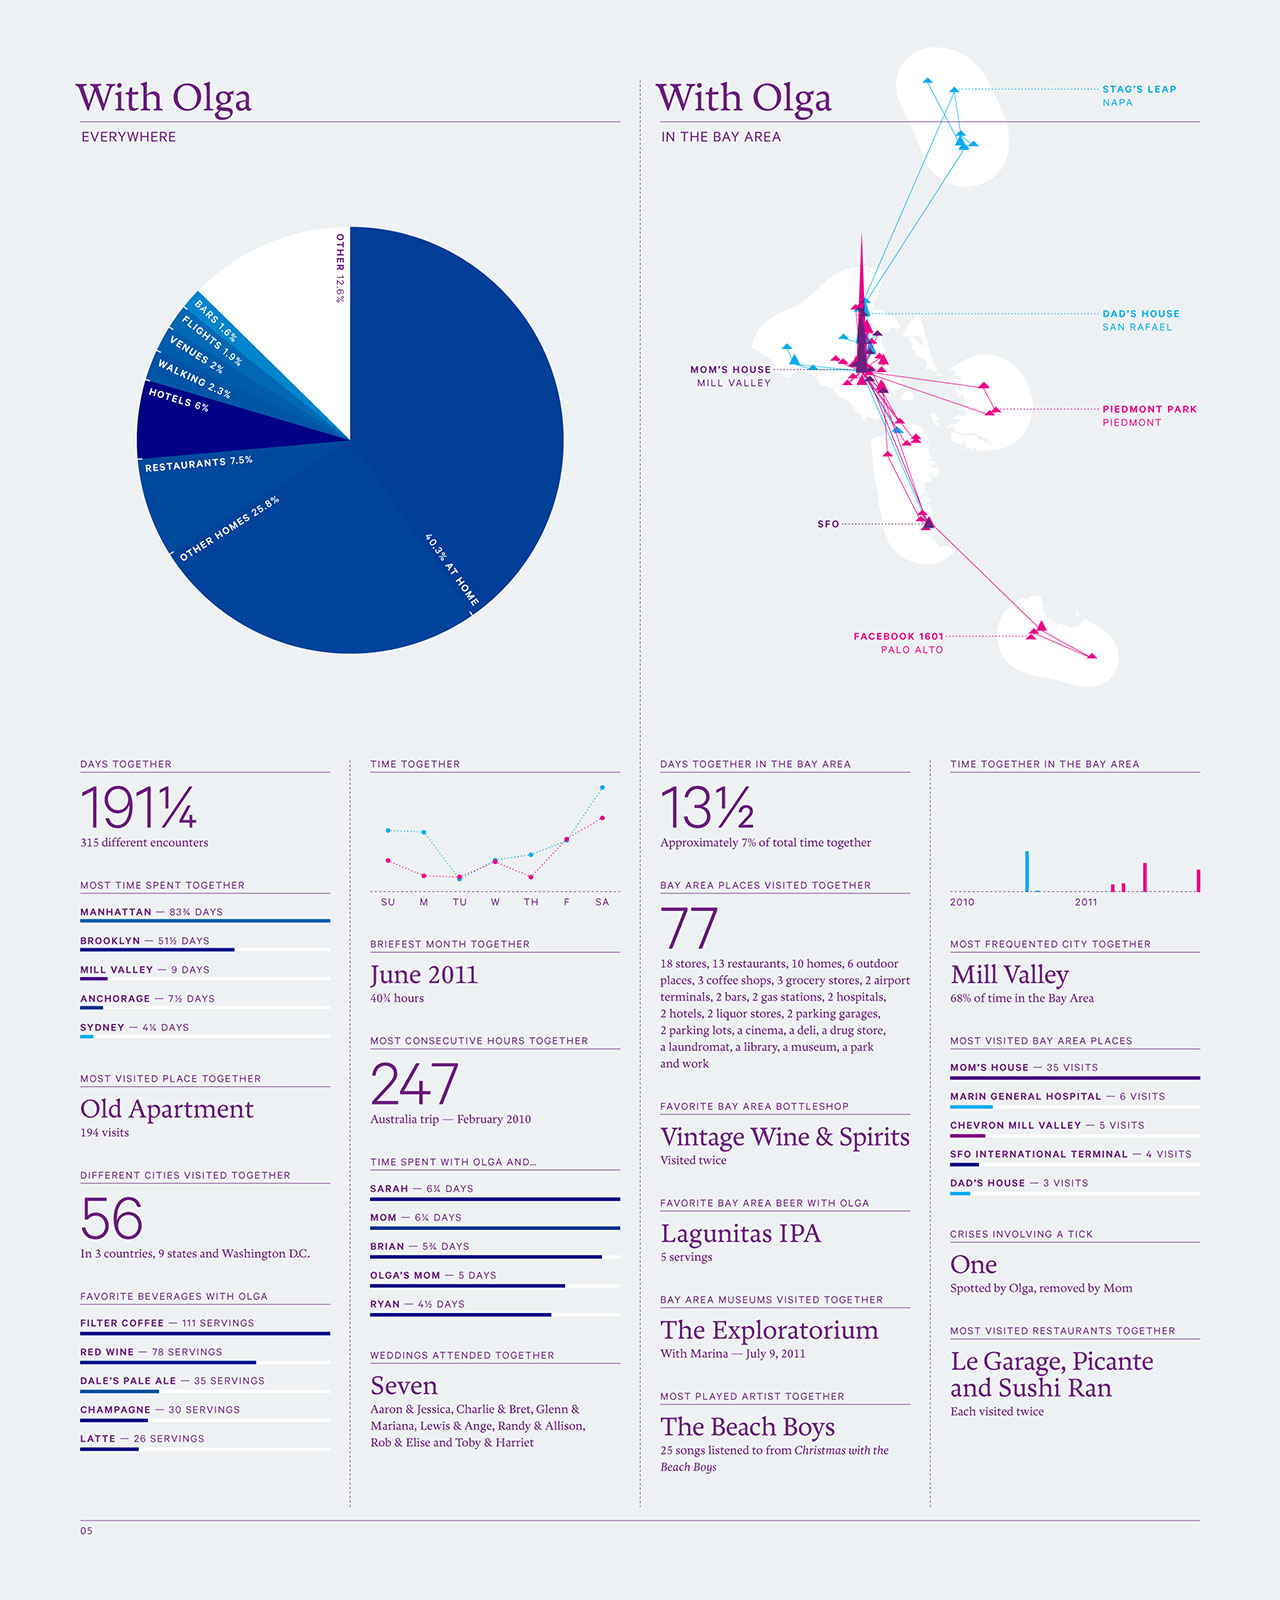
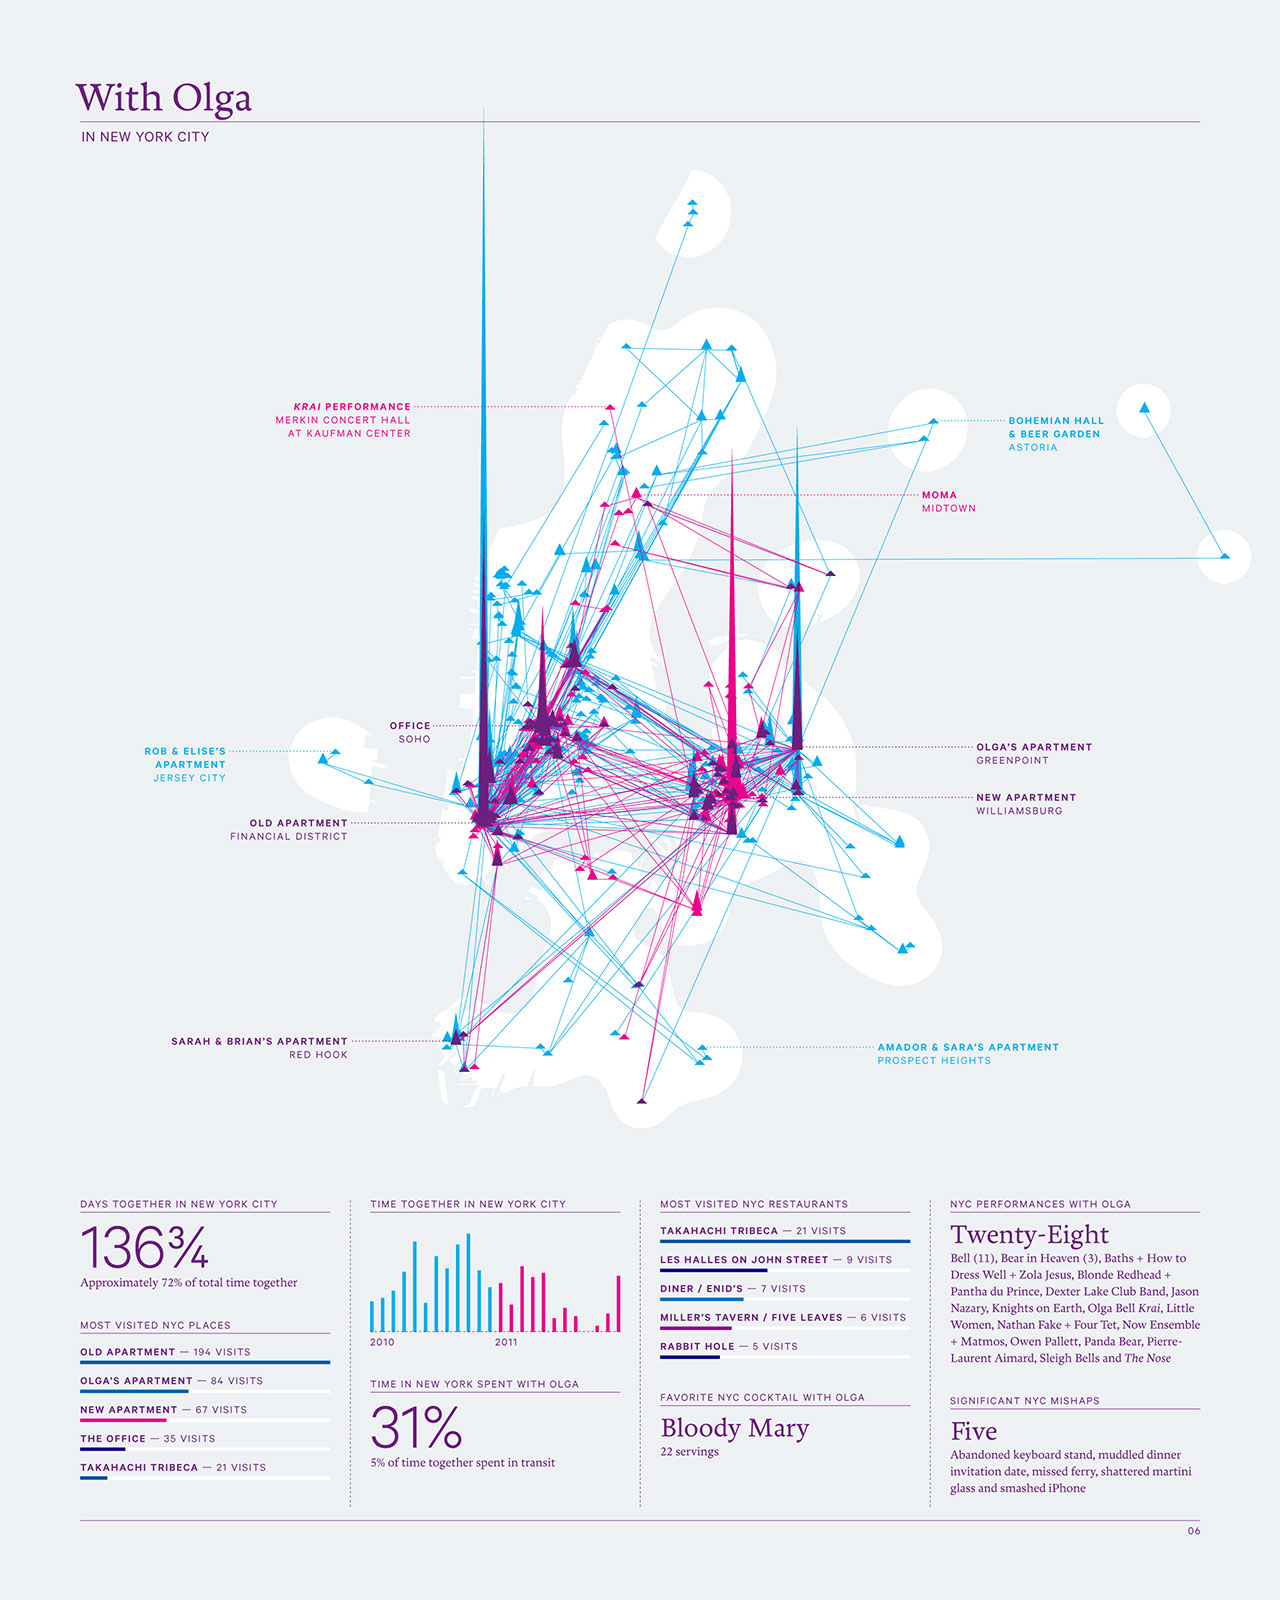
Images: Feltron. 2010/2011 Biennial Report. 2012
According to Phillip K. Dick, “a person’s authentic nature is a series of shifting, variegated planes that establish themselves as he relates to different people; it is created by and appears within the framework of his interpersonal relationships.”
The 2010/2011 Biennial Report is a compilation of Nicholas’s behaviour as a way to investigate the effects of interpersonal relationships on the development of an individual’s personality. In this report, visualisations of the variations in his personality based on the people he interacted with over a span of two years was being analysed.
This report captures the underlying themes and relations betweeen companies and how different groups of people affect one’s personality. In this sense, when one’s personality changes because of the community that the indidivudal is connected to, their identity is being transformed and reconfirgured as a result.
MINDMAPPING OF IDEAS
While writing the RPO, I felt quite lost as to how to sort my concepts and make a connection between the different themes that I was looking at in order to produce a meaningful and substantial analysis of the readings. Hence, to help myself understand and develop the concepts I was looking at for the research of my project, I used the Miro Mindmap tool to help me branch out ideas, quotes, links from the readers, and themes that I had established in my RPO and practical works.
Starting off from my topic, I branched out to identities through data where I linked to two overarching themes: online communities(where I explore concepts of data double, paradox, linguistic emotional expressions, social desirability, and freedom of expression) self-knowledge (where I look into data mirror–for self-undertsanding, bridging physical and online self, and individual growth and fulfillment). I also mapped out different types of behvauourial data that can be of help in my research to find out what makes up the identity of digital selves and what makes up a digital space in the context of my research. Additionally, I used the same Miro board to map out the possible ideas for my project as well. I think putting the ideas for practical work alongside the theory helps me to get an overview and evaluate the cross-over of concepts where such themes are applicable across theory and practice.
RPO
CONSULTATION
• Why is this research required
• What is it abut and what is achieved?
And conclude with how to achieve and here it can be your questions.
For Approaches/Methods:
• Read up on both Research through Design & Human-centric design and see which one fits your project the most.
→Link to IDEO works
• To look into human-centric approach:
• Human-Centric focuses alot on the community, you would have to work closely alongside people and your target audience to do this
→Link to Interaction Design Encyclopedia
• To look into research through design:
• Research Through Design is more on innovative prototyping, focuses more on the product itself
CODE EXPERIMENT 6
Visualising emotions & tone of voice through flexible shapes
COLOURS
FLEXIBLE
EVOLVING
SHAPES
For this experiment, I re-attempted to visualise our voices as our identities through a blob that is ever-changing to reflect the shape and colour of our voices. I decided to create two parameters: one for the shape, and one for the colour, to best determine the identity of the blob. Th shape will represent the tone of voice, whether its calm or loud etc, and colour will represent the emotion of the voicem yellow-happy, blue-sad etc.
On the right is the openprocessing code I referenced in order to use the perlin function to create a moving 'alive' shape
try it below!
Further Iterations Playing With Gradients
Images: Lesia Izikova Gradient Moods. 2017.
While mindmapping my ideas, I came across this artwork using gradients which inspired me to experiment using gradients for the colours of the shape. At times there might be multiple emotions at play, hence I thought it would be helpful to portray emotions using gradients instead–where one's voice is not restricted to only one emotion, but several.
Still trying to make the gradients work at the moment and might come back to this experiment again in the future, but below are what I have done so far using the concept of gradients
